UNITED STATES
SECURITIES AND EXCHANGE COMMISSION
Washington, D.C. 20549
SCHEDULE 14A
Proxy Statement Pursuant to Section 14(a) of
the Securities Exchange Act of 1934 (Amendment No. )
Filed by the Registrant ☒
Filed by a Party other than the Registrant ☐
Check the appropriate box:
☐ | Preliminary Proxy Statement |
☐ | ||
Confidential, for Use of the Commission Only (as permitted by Rule 14a-6(e)(2)) | ||
☒ | Definitive Proxy Statement |
☐ | Definitive Additional Materials |
☐ | Soliciting Material under §240.14a-12 |
AFFILIATED MANAGERS GROUP, INC.
(Name of Registrant as Specified In Its Charter)
(Name of Person(s) Filing Proxy Statement, if other than the Registrant)
Payment of Filing Fee (Check the appropriate box):
☒ | |||||
No fee required. | |||||
☐ | Fee computed on table below per Exchange Act Rules 14a-6(i)(1) and 0-11. | ||||
(1) | Title of each class of securities to which transaction applies: | ||||
(2) | Aggregate number of securities to which transaction applies: | ||||
(3) | Per unit price or other underlying value of transaction computed pursuant to Exchange Act Rule 0-11 (set forth the amount on which the filing fee is calculated and state how it was determined): | ||||
(4) | Proposed maximum aggregate value of transaction: | ||||
(5) | Total fee paid: | ||||
☐ | Fee paid previously with preliminary materials. | ||||
☐ | Check box if any part of the fee is offset as provided by Exchange Act Rule 0-11(a)(2) and identify the filing for which the offsetting fee was paid previously. Identify the previous filing by registration statement number, or the Form or Schedule and the date of its filing. | ||||
(1) | Amount Previously Paid: | ||||
(2) | Form, Schedule or Registration Statement No.: | ||||
(3) | Filing Party: | ||||
(4) | Date Filed: | ||||
AFFILIATED MANAGERS GROUP, INC.
777 South Flagler Drive
West Palm Beach, Florida 33401
NOTICE OF ANNUAL MEETING OF STOCKHOLDERS
TO BE HELD ON JUNE 14, 2016
NOTICE IS HEREBY GIVEN that the 20162019 Annual Meeting of Stockholders (the "Annual Meeting"“Annual Meeting”) of Affiliated Managers Group, Inc. (the "Company" or "AMG"“Company”) will be held on Tuesday, June 14, 2016,Wednesday, May 29, 2019, at 2:00 p.m. British Summer Time (9:10:00 a.m. Eastern Daylight Time),Time at the Company's LondonCompany’s office at 35 Park Lane, London W1K 1RB, United Kingdom,600 Hale Street, Prides Crossing, Massachusetts 01965, for the following purposes:
1. | To elect ten directors of the Company to serve until the 2020 Annual Meeting of Stockholders and until their respective successors are duly elected and qualified. |
2. | To approve, by a non‑binding advisory vote, the compensation of the Company’s named executive officers. |
3. | To ratify the selection of PricewaterhouseCoopers LLP as the Company’s independent registered public accounting firm for the current fiscal year. |
4. | To consider and act upon any other matters that may properly be brought before the Annual Meeting and at any adjournments or postponements thereof. |
This year, we have again saved significant mailing and printing costs and reduced our environmental impact by providing proxy materials to you over the Internet pursuant to Securities and Exchange Commission rules. On or about April 29, 2016,17, 2019, we will mail to our stockholders a Notice of Internet Availability of Proxy Materials (the "Notice"“Notice”) containing instructions on how to access thisthe Proxy Statement and our 20152018 Annual Report on Form 10-K10‑K online. The Notice, which cannot itself be used to vote your shares, also provides instructions on how to vote byover the Internet and how to request a paper copy of the proxy materials, if you so desire. Whether you receive the Notice or paper copies of our proxy materials, the Proxy Statement and 20152018 Annual Report on Form 10-K10‑K are available to you atwww.proxyvote.comwww.proxyvote.com.
The Company'sCompany’s Board of Directors fixed the close of business on April 15, 20162, 2019 as the record date for determining the stockholders entitled to notice of, and to vote at, the Annual Meeting and at any adjournments or postponements thereof. Your vote is very important. Please carefully review the Proxy Statement and submit your proxy byover the Internet, by telephone or by mail whether or not you plan to attend the Annual Meeting. If you hold your shares in street name through a broker, bank or other nominee, please follow the instructions you receive from them to vote your shares.
By Order of the Board of Directors. | ||
| ||
David M. Billings, | ||
General Counsel and Secretary | ||
West Palm Beach, Florida | ||
April 17, 2019 |
West Palm Beach, FloridaApril 29, 2016
AFFILIATED MANAGERS GROUP, INC.
777 South Flagler Drive
West Palm Beach, Florida 33401
PROXY STATEMENT
FOR 20162019 ANNUAL MEETING OF STOCKHOLDERS
TO BE HELD ON JUNE 14, 2016MAY 29, 2019
April 29, 201617, 2019
This Proxy Statement is furnished in connection with the solicitation of proxies by the Board of Directors of Affiliated Managers Group, Inc. ("(“AMG,"” the "Company," "we"“Company,” “we” or "us"“us”) for use at our 20162019 Annual Meeting of Stockholders to be held on Tuesday, June 14, 2016,Wednesday, May 29, 2019, at 2:00 p.m. British Summer Time (9:10:00 a.m. Eastern Daylight Time),Time at the Company's LondonCompany’s office at 35 Park Lane, London W1K 1RB, United Kingdom,600 Hale Street, Prides Crossing, Massachusetts 01965 and at any adjournments or postponements thereof (the "Annual Meeting"“Annual Meeting”). At the Annual Meeting, stockholders will be asked to elect eightten directors, approve, by a non-bindingnon‑binding advisory vote, the compensation of the Company'sCompany’s named executive officers (as defined in the "Executive“Executive Compensation Tables"Tables” section of this Proxy Statement), ratify the selection of PricewaterhouseCoopers LLP ("PricewaterhouseCoopers"(“PwC”) as our independent registered public accounting firm for the current fiscal year, and consider and act upon any other matters properly brought before them.
Important Notice Regarding the Internet Availability of Proxy Materials.This year, we have again saved significant mailing and printing costs and reduced our environmental impact by providing proxy materials to you over the Internet in accordance with Securities and Exchange Commission ("SEC"(“SEC”) rules. On or aboutApril 29, 2016,17, 2019, we will mail to our stockholders a Notice of Internet Availability of Proxy Materials (the "Notice"“Notice”) containing instructions on how to access this Proxy Statement and our 20152018 Annual Report on Form 10-K10‑K online. The Notice, which cannot itself be used to vote your shares, also provides instructions on how to vote byover the Internet and how to request a paper copy of the proxy materials, if you so desire. Whether you received the Notice or paper copies of our proxy materials, the Proxy Statement and 20152018 Annual Report on Form 10-K10‑K are available to you atwww.proxyvote.com.
Stockholders of record of the Company'sCompany’s common stock at the close of business on the record date of April 15, 20162, 2019 will be entitled to notice of the Annual Meeting and to one vote per share on each matter presented at the Annual Meeting. As of the record date, there were 53,811,45451,197,936 shares of common stock outstanding and entitled to vote at the Annual Meeting.
The presence, in person or by proxy, of holders of at least a majority of the total number of shares of common stock outstanding and entitled to vote at the Annual Meeting is necessary to constitute a quorum for the transaction of business at the Annual Meeting. Abstentions and broker non-votes,non‑votes, if any, will be counted as present and entitled to vote for purposes of establishing a quorum but will not be considered as votes cast on any matter.quorum.
A "broker non-vote"“broker non‑vote” is a proxy from a broker or other nominee indicating that such person has not received instructions from the beneficial owner on a particular matter with respect to which the broker or other nominee does not have discretionary voting power. Brokers have the discretion to vote their clients'clients’ proxies only on matters deemed "routine"“routine” by the New York Stock Exchange.Exchange (“NYSE”).
At this year'syear’s Annual Meeting, the election of directors (Proposal 1) and the advisory vote on executive compensation (Proposal 2) are non-routinenon‑routine matters, and only the ratification of our auditors (Proposal 3) is a routine matter. It is important that you instruct your broker as to how you wish to have your shares voted on these proposals, even if you wish to vote as recommended by the Board of Directors.
Stockholders are requested to submit a proxy byover the Internet or by telephone, or by returning a completed, signed and dated proxy card or voting instruction form. If you vote byover the Internet or by telephone, you should not return a proxy card or voting instruction form. Shares represented by a properly submitted proxy received prior to the vote at the Annual Meeting and not revoked will be voted at the Annual Meeting as directed by the proxy. If a properly executed proxy or voting instruction form is submitted without any instructions indicated, the proxy will be voted FOR the election of each of the nominees for director, FOR the approval of the advisory vote on executive compensation, and FOR the ratification of the selection of PricewaterhouseCoopersPwC as our independent registered
public accounting firm for the current fiscal year. If other matters are presented, proxies will be voted in accordance with the discretion of the proxy holders on such other matters.
A stockholder of record may revoke a proxy at any time before it has been voted by filing a written revocation with the Secretary of the Company at the Company'sCompany’s principal executive offices,office at 777 South Flagler Drive, West Palm Beach, Florida 33401-6152;33401‑6152, by submitting a duly executed proxy bearing a later date;date, or by appearing in person and voting by ballot at the Annual Meeting. A stockholder of record who voted byover the Internet or by telephone may also change his or her vote with a timely and valid later Internet or telephone vote. Any stockholder of record as of the record date may attend the Annual Meeting whether or not a proxy has previously been given, but the presence (without further action) of a stockholder at the Annual Meeting will not constitute revocation of a previously given proxy. If you hold your shares in street name and would like to change your voting instructions, please follow the instructions provided to you by your broker, bank or other intermediary.
A stockholder may vote in person at the Annual Meeting upon presenting picture identification and any one of the following: an account statement, the Notice or a proxy card. If you hold your shares in street name, you will need to obtain a proxy from your bank or broker in order to vote in person, and you must bring a brokerage statement or letter from your broker, bank or other intermediary reflecting stock ownership.ownership, along with picture identification. The address of the Company's LondonCompany’s office in Prides Crossing, Massachusetts is set forth above for stockholders who plan to vote in person at the Annual Meeting.
This summary highlights certain information from our Proxy Statement for the 20162019 Annual Meeting of Stockholders. You should read the entire Proxy Statement carefully before voting.
2019 Annual Meeting of Stockholders | |||||||||||
|
| ||||||||||
Meeting Information | Agenda Items | Recommendation | Additional Detail | ||||||||
May 29, 2019 10:00 a.m. Eastern Daylight Affiliated Managers Group, Inc. 600 Hale Street Prides Crossing, Massachusetts 01965 | Proposal 1—Election of Directors | FOR each Nominee | Page 11 | ||||||||
Proposal | FOR | Page | |||||||||
Proposal | FOR | Page | |||||||||
Company Overview |
|
| ||
AMG is a global asset management company with equity investments in leading boutique investment management firms, referred to as “Affiliates.” AMG’s innovative partnership approach allows each Affiliate’s management team to own significant equity in their firm and maintain operational autonomy. AMG’s strategy is to generate shareholder value through the growth of | existing Affiliates, as well as through investments in new Affiliates and additional investments in existing Affiliates. In addition, AMG provides centralized assistance to its Affiliates in strategic matters, marketing, distribution, product development and operations. As of December 31, 2018, AMG’s aggregate assets under management were $736.0 billion in more than 500 investment products across a broad range of active, return-oriented strategies. |
| ||
| |||||
Highly Independent | and Diverse Board | • Active Lead Independent Director with expansive |
| ||
• 25% of non-executive directors are non‑U.S. citizens | • New Executive Chairman role separates the CEO and Chairman functions
| ||||
•
|
| ||||
|
| ||||
Directors bring a wide array of qualifications, skills and attributes to |
| ||||
Active Board Refreshment | • 40% of the directors joined the Board within last five years • New chairs of all committees and a new Lead Independent Director in the last four years
| • Balanced mix of short‑ and long-tenured non‑executive directors; average tenure of eight years (shorter than the peer average) • Long-tenured directors in leadership roles | |||
Director Accountability, Development and Engagement | • 100% director | ||||
• Comprehensive orientation for new directors; ongoing development programs, with additional training for directors in new leadership roles | • Annual Board and committee self-evaluations and individual director assessments • Annual election of directors at majority vote | ||||
No
| • Three directors serve on boards of other public companies | • No director serves on more than one additional public company board | |||
Active Stockholder Engagement | • Active engagement, with regular stockholder outreach on topics including corporate governance and executive compensation
| • 2017-2018 outreach initiative to over 200 stockholders representing over 90% of voting shares •
| |||
Equity Ownership Guidelines | • 10x annual base salary for AMG’s CEO • 10x annual base salary for AMG’s President and CFO, increased in 2019 from 7x • 7x annual base salary for all other NEOs | • 5x annual base fees for non-executive directors • CEO and President and CFO each holds shares of AMG stock representing >25x their respective salaries, significantly exceeding the required levels | |||
Active Implementation of Long‑Term Succession Plan | • In 2018, AMG announced that Chairman and CEO Sean M. Healey had been diagnosed with ALS, and the Board immediately initiated its long‑term succession plan • The successful initiation of the Board’s long‑term succession plan was the culmination of advance evaluation and planning, to be in a position to immediately provide continuity of leadership in a time of unexpected transition | • In May 2018, Nathaniel Dalton (formerly President and COO) succeeded Mr. Healey as CEO and Mr. Healey was appointed Executive Chairman, and in early 2019 CFO Jay C. Horgen was appointed as President and AMG announced that a new CFO would be joining • Transition and succession planning activities are ongoing, with the continued enhancement of the senior management team through new and evolving roles | |||
Prioritization of Risk Management Oversight | and ESG Factors | • Board has principal responsibility for oversight of • Majority of directors have extensive background and experience in risk management |
| • A cross‑functional Sustainability Committee was formed in 2018, with oversight responsibility of • The Sustainability Committee reports to the Board at least annually, and includes members of AMG’s executive management team | |
Solid financial | • 2018 financial and operating results were impacted by industry-wide client risk aversion, as well as lower performance fees and elevated market
•
• AUM of $736 billion at year end, lower than the prior year, reflecting modestly negative flows for the year, as well as the impact of elevated market volatility and foreign exchange rate changes | • AMG’s 2018 GAAP results were largely impacted by a small number of one-time items, including non-cash impairment charges relating to two alternative Affiliates in 2018 and a one-time gain in the prior year relating to tax reform, as well as AMG’s donation to establish The Sean M. Healey and AMG Center for ALS at Mass General • Economic earnings per share
|
• | |||
Additional information on non-GAAP financial performance measures, including reconciliations to the most directly comparable GAAP measure, can be found in AMG’s Annual Report on Form 10-K under “Supplemental Financial Performance Measures.” Aggregate fees is an operating measure that consists of the total asset- and performance-based fees earned by all of AMG’s Affiliates, as further described in the Annual Report on Form 10-K. | ||||||
|
• Elevated market volatility increased industry‑wide client risk aversion, leading to modestly negative net • Strong long-term organic growth,
| |||||
• New office in • Continued focus on cultivating strong relationships with prospective new Affiliates in a challenging transaction environment, remaining highly selective while positioning AMG for new forward investment opportunities | Ongoing focus on capital management and pursuit of efficiency opportunities • Demonstrated commitment to returning capital to stockholders, with an increase in AMG’s quarterly cash dividend each year since its initiation, along with $490 million in share repurchases in 2018 and between $100 million and $300 million in repurchases targeted for the first half of 2019 • Lowered cost of capital and extended the duration of borrowings through the refinancing of AMG’s credit facilities; entered into foreign currency derivative contracts to access lower interest rates • Active review of AMG’s business for opportunities to improve efficiencies and support the positioning of Affiliates’ businesses for future opportunities; for example, combining the investment team at Trilogy Global Advisors with GW&K Investment Management • Reducing operating expenses at AMG while also working with a number of Affiliates to assist in aligning their business infrastructures with foreseeable opportunities and against evolving industry dynamics Execution on significant ESG initiatives, including the establishment of The Sean M. Healey and AMG Center for ALS at Mass General • A significant one‑time matching gift in 2018 established The Healey Center, uniting world experts to revolutionize treatments and pursue a cure for ALS, reflecting AMG’s commitment to non-profit organizations in our communities and to fostering a culture of philanthropy and sound corporate citizenship among our employees and peers | |||||
2018 stock decline, reflecting a period of elevated market volatility; strong long‑term stockholder value creation | Absolute stock performance • Stock
• Stockholder returns of +135% over the trailing 10-year period and +530% since AMG’s IPO; ‑38% and -54% over the 3‑ and 5‑year periods | Relative stock performance • 2018 stock performance fell behind AMG’s Peer Group average, as well as the S&P 500® • Stockholder returns in 2018 were impacted across the sector, with stock prices declining ‑36% at the median across publicly traded traditional asset managers, relative to the ‑6% return generated by the S&P 500® index • Long-term stock performance outpaced AMG’s Peer Group median over the 10‑year period | ||||
Compensation Program and Governance Changes |
Positive Stockholder Feedback on 2017 Compensation Program Enhancements |
At AMG’s last Annual Meeting, over 94% of stockholder votes cast were in favor of named executive officer compensation, reflecting strong support for AMG’s executive compensation program design and its demonstrated linkage of pay-for-performance. This high level of support followed a comprehensive outreach to stockholders to discuss a broad range of topics, including executive compensation and governance matters. During this outreach, senior management attended in-person meetings with top institutional investors and major proxy advisory firms, in several of which AMG’s Compensation Committee Chair, Jide Zeitlin, participated. The Compensation Committee considered the feedback from this outreach, and implemented meaningful enhancements to AMG’s compensation program in 2017.
During ongoing stockholder engagement, stockholders expressed strong support for the 2017 enhancements, including those summarized below:
▪ Significantly increased the proportion of performance-based equity awards to 60% of AMG’s CEO’s total equity incentive awards, with the result that performance-conditioned equity is now the largest component of total CEO compensation
▪ Implemented a new return on equity metric for performance awards, to better align management incentives with the strategic goals of both growing earnings and effectively managing capital
▪ Revised the weightings of the performance scorecard categories to increase the quantitative financial and stock performance factors and reduce the weighting of the more subjective strategic factors
▪ Significantly expanded the Performance Assessments disclosure, including disclosure of the scores for each scorecard category as well as the financial targets used to determine formulaic cash bonus awards
▪ Eliminated performance award “re-testing” concerns through the use of a single operating metric hurdle measured over a single three‑year period
▪ Established distinct caps on Performance-Based Incentive Compensation for each NEO, in addition to the CEO, and lowered the existing cap on CEO Performance-Based Incentive Compensation by 20% in 2017
Over 94% of stockholder votes cast were in favor of NEO compensation in AMG’s 2018 Say-on-Pay Vote
2018 Stockholder Comments and Additional Governance and Compensation Program Enhancements | ||||||
|
| |||||
Stockholder Comments | ||||||
AMG Response
Comment #1 | Maximum award values remain high |
|
| |
Comment #2 | CEO compensation | |||
|
| |||
Comment #3 | Performance Assessments should be more formulaic | ▪ Performance Assessment scorecards have been enhanced to add disclosure of sub‑category weightings, for both the Long-Term and Short-Term Performance Assessments
| ||
Comment #4 | Executives should hold significantly larger equity stakes | ▪ Equity Ownership Guidelines were revised in 2019 to increase the holding requirement for
| ||
Comment #5 | ESG activities should factor into incentive award decisions | ▪ Formal weighting of | ||
Comment #6 | Greater attention should be paid to ESG matters | ▪ During 2018, AMG made significant progress in implementing a number of key ESG initiatives, including: - new policies and practices to promote an inclusive and diverse work environment - completed the first inventory and secured third-party attestation of AMG’s GhG Emissions and participated in the CDP Climate Change Information Request - transitioned to renewable energy sources at multiple office locations - eliminated single-use plastic water bottles and straws from AMG’s principal offices - further focused efforts to promote procurement of products and materials which have high concentrations of recycled materials ▪ AMG and The AMG Charitable Foundation both donate to a variety of non-profit organizations and community programs globally, and in 2018 approved a significant charitable gift to establish The Sean M. Healey and AMG Center for ALS at Mass General | ||
Additional information on non-GAAP financial performance measures, including reconciliations to the most directly comparable GAAP measure, can be found in AMG’s Annual Report on Form 10-K under “Supplemental Financial Performance Measures.”
Long-Term Incentive Compensation Performance Assessment |
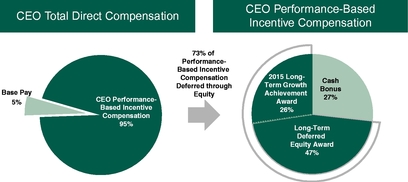
• An overall weighted score of 33.3%, reflecting the challenging environment for active asset managers and the recent stock performance in particular, was applied to the capped annual amount of equity incentive awards of $13.5 million, resulting in a formulaic equity incentive award for AMG’s CEO of $4.5 million • The Committee’s allocation for this equity incentive award amount was 40% in the form of Long-Term Deferred Equity Awards and 60% in the form of Long-Term Performance Achievement Awards, consistent with the targeted allocations |
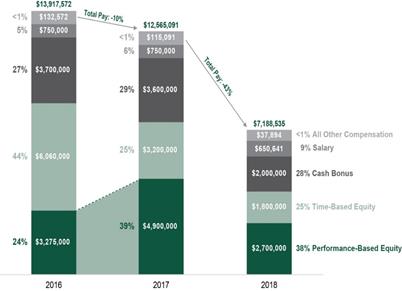
 |  2018 Compensation Results and Elements of Compensation |
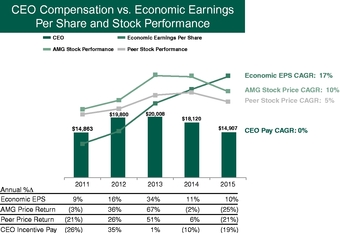
Note: Stock price performance and CAGRs calculated beginning on 12/31/2010. AMG 2015 CEO Compensation includes long-term equity earned for performance during 2015; see "Supplemental Table—Compensation Earned in Fiscal 2015" below for information regarding differences from the Summary Compensation Table.
Total 2018 CEO compensation declined ‑43% compared to 2017 and total NEO compensation declined more than ‑20%, reflecting a significant reduction in the caps on the Performance-Based Incentive Compensation of AMG’s CEO, as well as the results of the Compensation Committee’s formal Performance Assessments, which considered AMG’s stock performance, financial and operating results and strategic performance for the year and over the long-term, on both a relative and an absolute basis, as well as the business initiatives achieved over the year and AMG’s performance against pre-established financial performance targets, and produced formulaic cash bonus and equity incentive awards. Consistent with prior years, a significant proportion of incentive-based compensation was in the form of performance-based equity awards, which were 60% of total CEO equity incentive awards and were the largest component of total CEO compensation. These awards are subject to three-year cliff vesting, with delivery tied to rigorous return on equity targets that align management incentives with the strategic goals of growing earnings and effectively managing capital. |
|
Supplemental Table—Compensation Earned in Fiscal Year 2018 |
Name and Principal Position |
| Salary |
|
| Cash Bonus |
|
| Long-Term Deferred Equity Awards |
|
| Long-Term Performance Achievement Awards |
|
| All Other Compensation |
|
| Total Compensation Earned | ||||||||
Nathaniel Dalton |
| $ | 650,641 |
|
| $ | 2,000,000 |
|
| $ | 1,800,000 |
|
| $ | 2,700,000 |
|
| $ | 37,894 |
|
|
| $ | 7,188,535 |
|
Chief Executive Officer |
|
|
|
|
|
|
|
|
|
|
|
|
|
|
|
|
|
|
|
|
|
|
|
|
|
Sean M. Healey |
| $ | 750,000 |
|
| $ | 2,975,000 |
|
| $ | 1,905,000 |
|
| $ | 1,270,000 |
|
| $ | 263,279 |
|
|
| $ | 7,163,279 |
|
Executive Chairman |
|
|
|
|
|
|
|
|
|
|
|
|
|
|
|
|
|
|
|
|
|
|
|
|
|
Jay C. Horgen |
| $ | 500,000 |
|
| $ | 1,650,000 |
|
| $ | 1,400,000 |
|
| $ | 2,100,000 |
|
| $ | 45,685 |
|
|
| $ | 5,695,685 |
|
President, Chief Financial Officer and Treasurer |
|
|
|
|
|
|
|
|
|
|
|
|
|
|
|
|
|
|
|
|
|
|
|
|
|
Hugh P. B. Cutler |
| $ | 400,000 |
|
| $ | 800,000 |
|
| $ | 480,000 |
|
| $ | 720,000 |
|
| $ | 34,979 |
|
|
| $ | 2,434,979 |
|
Executive Vice President and Head of Global Distribution |
|
|
|
|
|
|
|
|
|
|
|
|
|
|
|
|
|
|
|
|
|
|
|
|
|
David M. Billings |
| $ | 400,000 |
|
| $ | 1,100,000 |
|
| $ | 240,000 |
|
| $ | 360,000 |
|
| $ | 33,554 |
|
|
| $ | 2,133,554 |
|
General Counsel and Secretary |
|
|
|
|
|
|
|
|
|
|
|
|
|
|
|
|
|
|
|
|
|
|
|
|
|
Supplemental Table—Compensation Earned in Fiscal 2015
The following table sets forth the 2015 compensation results for our NEOs. This table includesabove tables include equity awards granted to our NEOsthe Company’s named executive officers in February 20162019 in recognition of 20152018 performance and excludes(and exclude equity awards granted in January of 20152018 in recognition of 2014 performance,2017 performance), to better demonstrate how we evaluatethe Company evaluates and compensate our NEOs.compensates its named executive officers. These amounts differ from the compensation reported in the Summary Compensation Table because SEC rules governing the reporting of compensation in that table require equity awards to be reported in the fiscal year of grant, even where the awards are intended to compensate executives for performance in a prior year. Please refer to the "Executive“Executive Compensation Tables"Tables” and "Equity“Equity Grant Policy"Policy” sections of this Proxy Statement for additional information.
Name and Principal Position | Salary | Cash Bonus | Long-Term Deferred Equity Awards | 2015 Long-Term Growth Achievement Awards | All Other Compensation | Total 2015 Compensation Earned | |||||||||||||
|---|---|---|---|---|---|---|---|---|---|---|---|---|---|---|---|---|---|---|---|
Sean M. Healey | $ | 750,000 | $ | 3,850,000 | $ | 6,575,000 | $ | 3,575,000 | $ | 156,689 | $ | 14,906,689 | |||||||
Nathaniel Dalton | $ | 500,000 | $ | 2,300,000 | $ | 3,950,000 | $ | 2,100,000 | $ | 49,631 | $ | 8,899,631 | |||||||
Jay C. Horgen | $ | 500,000 | $ | 1,950,000 | $ | 2,940,000 | $ | 1,600,000 | $ | 62,356 | $ | 7,052,356 | |||||||
Andrew Dyson | $ | 403,550 | $ | 1,538,230 | $ | 1,445,000 | $ | 780,000 | $ | 39,346 | $ | 4,206,126 | |||||||
David M. Billings | $ | 400,000 | $ | 1,400,000 | $ | 585,000 | $ | 315,000 | $ | 31,294 | $ | 2,731,294 | |||||||
PROPOSAL 1: ELECTION OF DIRECTORS
Introduction
Our Board of Directors currently consists of eightten members. At the Annual Meeting, eightten directors are expected to be elected to serve until the 20172020 Annual Meeting of Stockholders and until their respective successors are duly elected and qualified. The Board of Directors, upon the recommendation of the Nominating and Governance Committee, has nominated Messrs. Samuel T. Byrne, Dwight D. Churchill, Nathaniel Dalton, Glenn Earle, Niall Ferguson, Sean M. Healey, Patrick T. Ryan and Jide J. Zeitlin, and Ms.Mses. Tracy P. Palandjian and Karen L. Yerburgh (collectively, the "Nominees"“Nominees”), to serve as directors. Each of the Nominees is currently serving as a director of the Company. As more fully discussed below in the "Corporate“Corporate Governance Matters and Meetings of the Board of Directors and Committees"Committees” section of this Proxy Statement, the Board of Directors has determined that seven of its eightten Nominees, Messrs. Byrne, Churchill, Earle, Ferguson, Ryan and Zeitlin, and Ms. Palandjian, have no material relationship with the Company and, therefore, are independent for purposes of New York Stock Exchange ("NYSE")NYSE listing standards. The Board of Directors expects that each of the Nominees will, if elected, serve as a director for the new term. However, if any person nominated by the Board of Directors is unable to accept election, the proxies will be voted for the election of such other person or persons as the Board of Directors may recommend.
The Company'sCompany’s amended and restated by-lawsby‑laws (the "By-laws"“By‑laws”) provide for majority voting in uncontested director elections. Under the majority voting standard, directors are elected by a majority of the votes cast, which means that the number of shares voted "for"“for” a director must exceed the number of shares voted "against"“against” that director. In a contested election (a situation in which the number of nominees exceeds the number of directors to be elected), the standard for the election of directors will be a plurality of the votes cast. Abstentions and broker non-votesnon‑votes will have no effect on the outcome of the vote on the election of directors.
Under our Corporate Governance Guidelines, the Nominating and Governance Committee has established procedures for any director who is not elected to tender his or her offer to resign. Upon receiving the director'sdirector’s offer to resign, the Nominating and Governance Committee will recommend to the Board of Directors whether to accept or reject the offer to resign, or whether other action should be taken. The Nominating and Governance Committee and the Board of Directors, in making their decisions, may consider any factor or information that they deem relevant. The Board of Directors, taking into account the Nominating and Governance Committee'sCommittee’s recommendation, will act on the tendered resignation within ninety days following certification of the election results. A director whose resignation is under consideration shallmust abstain from participating in any recommendation or decision regarding his or her resignation.
Recommendation of the Board of Directors
The Board of Directors believes that the election of each of the Nominees is in the best interests of the Company and its stockholders and, therefore, unanimously recommends that stockholders voteFOR the election of each of the Nominees.
Information Regarding the Nominees
The following table sets forth the name, age (as of April 1, 2016)2019), tenure and other information of each Nominee, along with the committees of the Board of Directors on which each Nominee currently serves.
Director Nominee Information: Committee Memberships | |||||||||||||||
Name |
| Age |
| Compensation Committee |
| Nominating and Governance Committee |
| Audit Committee |
| Independence |
| Tenure (Years) |
| Other Public Boards | |
Samuel T. Byrne |
| 54 |
| ✓ |
| ✓ |
| ✓ |
| ✓ |
| 10 |
| — | |
Dwight D. Churchill |
| 65 |
|
|
|
|
| ✓ (Chair) |
| ✓ |
| 9 |
| — | |
Nathaniel Dalton Chief Executive Officer |
| 52 |
|
|
|
|
|
|
|
|
| 1 |
| — | |
Glenn Earle |
| 61 |
|
|
|
|
| ✓ |
| ✓ |
| 4 |
| 1 | |
Niall Ferguson |
| 54 |
|
|
| ✓ |
|
|
| ✓ |
| 5 |
| — | |
Sean M. Healey Executive Chairman |
| 57 |
|
|
|
|
|
|
|
|
| 18 |
| — | |
Tracy P. Palandjian |
| 48 |
|
|
| ✓ |
| ✓ |
| ✓ |
| 7 |
| — | |
Patrick T. Ryan Lead Independent Director |
| 60 |
| ✓ |
| ✓ (Chair) |
| ✓ |
| ✓ |
| 14 |
| 1 | |
Karen L. Yerburgh |
| 56 |
|
|
|
|
|
|
|
|
|
| 1 |
| — |
Jide J. Zeitlin |
| 55 |
| ✓ (Chair) |
|
|
| ✓ |
| ✓ |
| 13 |
| 1 | |
|
| Average Age of 56 |
| 100% Independent; New Chair in 2015 |
| 100% Independent; New Chair in 2015 |
| 100% Independent; 100% Financial Experts; New Chair in 2015 |
| 7 of 10 Directors are Independent |
| Average Tenure = ~8 years |
| No Overboarding | |
|
|
|
|
|
|
|
|
|
|
Director Nominee Information: Committee Memberships | |||||||||||||||||||
| | | | | | | | | | | | | | | | | | | | |
Name | | Age | Compensation Committee | Nominating and Governance Committee | | Audit Committee | Independence | | Tenure (Years) | | Other Public Boards | ||||||||
Samuel T. Byrne | 51 | ü | ü | ü | ü | 7 | — | ||||||||||||
| | | | | | | | | | | | | | | | | | | | |
Dwight D. Churchill | 62 | ü (Chair) | ü | 6 | — | ||||||||||||||
| | | | | | | | | | | | | | | | | | | | |
Glenn Earle | 58 | ü | ü | 1 | 1 | ||||||||||||||
| | | | | | | | | | | | | | | | | | | | |
Niall Ferguson | 51 | ü | ü | 2 | — | ||||||||||||||
| | | | | | | | | | | | | | | | | | | | |
Sean M. Healey | 54 | 15 | — | ||||||||||||||||
| | | | | | | | | | | | | | | | | | | | |
Tracy P. Palandjian | 45 | ü | ü | ü | 4 | — | |||||||||||||
| | | | | | | | | | | | | | | | | | | | |
Patrick T. Ryan | 57 | ü | �� ü (Chair) | ü | ü | 11 | 1 | ||||||||||||
| | | | | | | | | | | | | | | | | | | | |
Jide J. Zeitlin | 52 | ü (Chair) | ü | 10 | 2 | ||||||||||||||
| | | | | | | | | | | | | | | | | | | | |
| Average Age = 54 | 100% Independent; New Chair in 2015 | 100% Independent; New Chair in 2015 | 100% Independent; 100% Financial Experts; New Chair in 2015 | 7 of 8 Directors are Independent | Average Tenure = ~7 years | No Overboarding | |||||||||||||
| | | | | | | | | | | | | | | | | | | | |
The Nominees bring a wide array of qualifications, skills and attributes to our Board of Directors that strengthen the Board of Director's ability to carry outsupport its oversight role on behalf of our stockholders. The most relevant of these qualifications and skills are summarized in the table below:
Director Experience and Skills Overview |
Financial, accounting or financial reporting | We use a broad set of financial metrics to measure our operating and strategic performance. Accurate financial reporting and rigorous auditing are critical to our success. We seek to have | Directors | ||
Investment management | ||||
Directors with investment management experience provide the Board with an enhanced understanding and assessment of our business strategy and bring valuable perspective on | 8 of | |||
Global business | Our continued success depends in part on the sustained growth of our international operations, and we seek directors with global business experience, including managing and growing organizations worldwide. | 8 of | ||
Leadership | ||||
We seek directors who have held significant leadership positions, as we believe this experience provides directors with a practical understanding of organizations, processes, strategy, risk management and other factors that promote growth. | 10 of | |||
Other public company board experience | Directors with experience serving on other public company boards provide valuable operations and management perspectives, which | 3 of | ||
Public policy and government affairs | We and our Affiliates operate in a highly regulated industry and are directly affected by governmental actions and socioeconomic trends and, therefore, we seek directors with experience with governmental, regulatory and related organizations. | 4 of | ||
Risk management and compliance | Risk management is critical to the success of our business, and we seek directors with regulatory and compliance expertise, as well as experience managing and overseeing risk in public and private companies and in other contexts. | 8 of | ||
Environmental, social and governance | Directors who have experience in managing environmental, sustainability and social issues are able to assist the Board in overseeing and advising management to ensure that strategic business imperatives and long-term value creation for stockholders are achieved within a responsible, sustainable business plan. | 6 of | ||
Operational | ||||
We believe that directors with experience in operations are able to assess and advise management on the formulation and execution of our business strategy. | 8 of | |||
The following biographical summaries provide additional information on the business experience, principal occupation and past employment and directorships of each Nominee during at least the last five years.
Director Biographical Information |
Samuel T. Byrne Audit Committee, Compensation Committee, & Nominating and Governance Committee | Samuel T. Byrne has been a director of the Company since October 2009. Mr. Byrne is a Managing Partner and co-founder of CrossHarbor Capital Partners LLC, a leading alternative investment management firm specializing in real estate, as well as distressed securities and private equity. The firm manages institutional capital on behalf of investors globally, including public pension systems, endowments and foreign institutions such as sovereign wealth funds. Before founding CrossHarbor Capital Partners, Mr. Byrne served as a management consultant advising on corporate restructurings and bankruptcy matters. Prior to that, he was a portfolio manager at Fleet Financial Group and Bank of New England. Mr. Byrne currently serves as | |
Dwight D. Churchill Audit Committee (Chair) | Dwight D. Churchill has been a director of the Company since February 2010. Mr. Churchill held a number of senior positions at Fidelity Investments before retiring from the firm in 2009. Having joined Fidelity in 1993, he served as the head of the Fixed Income Division, head of Equity Portfolio Management and President of Investment Services. While at Fidelity, Mr. Churchill also served as the elected chair of the Board of Governors for the CFA Institute, a 135,000-member association previously known as the Association for Investment Management & Research, and from June 2014 to January 2015, he served as interim President and Chief Executive Officer at the CFA Institute. Prior to joining Fidelity, Mr. Churchill served as a Managing Director of Prudential Financial, Inc., | |
Nathaniel Dalton Chief Executive Officer | ||
Nathaniel Dalton is the Company’s Chief Executive Officer. Mr. Dalton was appointed Chief Executive Officer in May 2018, and has been a director of the Company since that time. Mr. Dalton joined AMG in 1996 as its first General Counsel, and has subsequently held a series of leadership positions within the firm. Most notably, Mr. Dalton was responsible for leading AMG’s relationships with its Affiliates for nearly 20 years as well as building AMG’s global distribution platforms. In 2006, Mr. Dalton was named Chief Operating Officer and he became President in 2011. Prior to joining the Company in 1996, Mr. Dalton was an attorney at Goodwin Procter LLP in Boston, focusing on mergers and acquisitions. Mr. Dalton serves as the Chairman of the Boston University Board of Overseers, is a Trustee of the University and serves on the Investment Committee for its Endowment. He received a J.D. from Boston University School of Law and a B.A. from the University of Pennsylvania. We believe that Mr. Dalton’s qualifications to serve on our Board of Directors include his direct knowledge of the Company’s strategy and operations through his service as Chief Executive Officer and in other leadership positions at the Company, including President and Chief Operating Officer, and his extensive experience in the financial services and investment management industries. |
Tracy P. Palandjian Audit Committee & Nominating and Governance Committee | Tracy P. Palandjian has been a director of the Company since March 2012. Ms. Palandjian is the Chief Executive Officer, co-founder and | |
Corporate Governance Matters and Meetings of the Board of Directors and Committees
�� The Board of Directors and management regularly review best practices in corporate governance and modify our corporate governance policies and practices as warranted. Our current best practices include:
Governance Highlights |
Board of Directors: During 2015,2018, the full Board of Directors met six times. Each incumbent member of the Board of Directors in 20152018 attended 100% of the meetings of the full Board of Directors and at least 96%90% of the total number of meetings of (i) the Board of Directors and (ii) all standing committees of the Board of Directors on which such director served.served, with an average attendance rate at Board and committee meetings of over 98%. We do not have a formal policy regarding director attendance at our Annual Meeting of Stockholders. One director attended the 20152018 Annual Meeting of Stockholders.
At least annually, the Board of Directors evaluates the independence of our directors in light of the standards established by NYSE. A majority of our Board of Directors must be independent within the meaning of NYSE listing standards. After its most recent evaluation of director independence, the Board of Directors affirmatively determined that seven of our eightten current directors, Messrs. Byrne, Churchill, Earle, Ferguson, Ryan and Zeitlin, and Ms. Palandjian, are "independent"“independent” for purposes of NYSE listing standards. The Board of Directors made theseits determinations based upon individual evaluations of each director'sthese directors’ employment or board of directors affiliations, compensation history and any commercial, family
or other relationships.relationships with the Company. There were no transactions between any non-executive director and the Company for the Board of Director'sDirectors’ consideration in determining the independence of any non-executiveindependent director. Members of the Board of Directors also serve as directors, trustees or in similar capacities (but not as executive officers or employees) for non-profit organizations to which we may make charitable contributions from time to time. Contributions to these organizations did not exceed either $120,000 or 1% of each of those organizations'organizations’ annual consolidated gross revenues during their last completed fiscal years.
The standing committees of the Board of Directors are the Audit Committee, the Compensation Committee, and the Nominating and Governance Committee. Only independent directors within the meaning of NYSE listing standards serve on these committees. Other members of the Board of Directors may attend committee meetings from time to time at the invitation of the respective committee. Each such committee acts pursuant to a written charter adopted by the respective committee. AThe members and chairs of each committee are set forth above in the table titled “Director Nominee Information: Committee Memberships,” and a description of each committee is set forth below.
Audit Committee: The Audit Committee currently consists of Messrs. Byrne, Churchill, Earle and Ryan, and Ms. Palandjian, with Mr. Churchill serving as Chair since January 2015. Each of the members meets the independence standards applicable to audit committees under the Sarbanes-OxleySarbanes‑Oxley Act of 2002 and NYSE listing standards and is an audit committee financial expert, as defined by the SEC. The Audit Committee'sCommittee’s purpose is to assist the Board of Directors in oversight of our internal controls and financial statements and the audit process. The Audit Committee met eight times during 2015. Other members of the Board of Directors attend Audit Committee meetings from time to time at the invitation of the Audit Committee.2018.
Compensation Committee: The Compensation Committee currently consists of Messrs. Byrne, Ryan and Zeitlin, with Mr. Zeitlin serving as Chair since February 2015. Each member meets the independence requirements applicable to the Compensation Committeecompensation committees under NYSE listing standards. The Compensation Committee is responsible for overseeing our general compensation policies and establishing and reviewing the compensation plans and benefit programs applicable to our executive officers. In that capacity, the Compensation Committee also administers our stock option and incentive plans. The Compensation Committee met sixfour times during 2015. Other members of the Board of Directors attend Compensation Committee meetings from time to time at the invitation of the Compensation Committee.2018.
Nominating and Governance Committee: The Nominating and Governance Committee currently consists of Messrs. Byrne, Ferguson and Ryan, and Ms. Palandjian, with Mr. Ryan serving as Chair since February 2015. The Nominating and Governance Committee is primarily responsible for recommending criteria to the Board of Directors for Board and committee membership, identifying and evaluating director candidates, overseeing the annual self-assessmentself‑assessment of the Board of Directors and its committees and of the Chairman and Chief Executive Officer, overseeing Chief Executive Officer and other key executive succession planning and maintaining our Corporate Governance Guidelines. The Nominating and Governance Committee met five times during 2015. Other members of the Board of Directors attend Nominating and Governance Committee meetings from time to time at the invitation of the Nominating and Governance Committee.2018.
The Nominating and Governance Committee may solicit director candidate recommendations from a number of sources, including directors, executive officers and third-partythird‑party search firms. The Nominating and Governance Committee will consider for nomination any director candidates, including director candidates recommended by our stockholders, who are deemed qualified by the Nominating and Governance Committee in light of the qualifications and criteria for Board of Directors membership described below, or such other criteria as approved by the Board of Directors or a committee thereof from time to time. Stockholder recommendations must be submitted to the Nominating and Governance Committee in accordance with the requirements set forth in the By-laws,By‑laws, including those discussed in the "Other“Other Matters—Stockholder Proposals"Proposals” section of this Proxy Statement, and any procedures established from time to time by the Nominating and Governance Committee. The Nominating and Governance Committee does not have a specific policy regarding the consideration of stockholder recommendations for director candidates and considers this appropriate because it evaluates recommendations without
regard to their source. The Nominating and Governance Committee evaluates any potential conflicts of interest on a case-by-casecase‑by‑case basis, to the extent they may arise.
The Board of Directors believes that a diverse mix of perspectives and expertise enhances its overall effectiveness. When considering candidates for directorship, including nominees currently serving as directors of the Company, the Nominating and Governance Committee takes into account a number of factors, including the following qualifications: the nominee shallmust have the highest personal and professional integrity and have demonstrated exceptional ability and judgment and the attributes necessary (in
conjunction with the other members of the Board of Directors) to best serve the long-termlong‑term interests of the Company and its stockholders. In addition, the Nominating and Governance Committee reviews from time to time the skills and characteristics necessary and appropriate for directors in light of the then current composition of the Board of Directors, including such factors as business experience, international background, diversity and knowledge of the financial services industry in general and the asset management industry in particular. following factors:
Director Qualifications and Attributes | |
• Business and leadership experience, including experience managing and growing organizations worldwide | • Knowledge of the financial services industry and, in particular, the asset management industry |
• Diversity—in particular, gender diversity, along with geographic, experiential and ethnic diversity | • Understanding of organizations, processes, strategy, risk management and other factors that promote growth |
• Understanding of finance and financial reporting processes | |
In considering diversity, the Nominating and Governance Committee considers diversity of background and experience, as well as ethnicethnicity, gender and other forms of diversity. The Nominating and Governance Committee recognizes the importance of gender diversity, in particular, as an important factor to consider when evaluating the composition of the Board of Directors. The Nominating and Governance Committee does not have a formal policy regarding diversity in identifying nominees for a directorship, but rather considers it among the various factors relevant to the consideration of any particular nominee. The Nominating and Governance Committee reviews our Corporate Governance Guidelines at least annually to ensure that we continue to meet best corporate governance practice standards.
The current Board of Directors comprises individuals with a substantial variety of skills and expertise, including with respect to investment management across the capital markets; real estate; private equity; international business; academiaacademia; and not-for-profitnot‑for‑profit organizations. The Nominating and Governance Committee believes it is important to maintain a mix of experienced directors with a deep understanding of the Company and newer directors who bring a fresh perspective. The following are highlights characterizeon the composition of our current Board of Directors:
Board of Directors Composition | |||
| • 25% of the non-executive directors are non-U.S. citizens | ||
• 40% of the directors joined the Board within last five years; Average non-executive director tenure of | • Average director age of 56 | ||
• New chairs of all Board committees in |
| ||
| • Long-tenured directors in leadership roles | ||
Succession Planning: The Nominating and Governance Committee has primary responsibility for Chief Executive Officer and other key executive succession planning. Succession planning and executive development are fundamental components of the Board of Directors’ governance responsibilities, and are regularly discussed by the Committee with management present as well as in executive sessions. This advance evaluation and planning put the Board of Directors in a position to immediately react to the developments in 2018 that led to the initiation of its long‑term succession plan. In May 2018, the Company announced that Sean M. Healey had been diagnosed with amyotrophic lateral sclerosis (a motor neuron disease otherwise known as ALS, or Lou Gehrig’s disease). The Board of Directors immediately initiated its long‑term succession plan, with Nathaniel Dalton, the Company’s then President and Chief Operating Officer, succeeding Mr. Healey as Chief Executive Officer and joining the Board of Directors, and Mr. Healey appointed as Executive Chairman. This was followed in early 2019 by the appointment of Jay C. Horgen, the Company’s Chief Financial Officer, as President and the announcement that a new Chief Financial Officer, Thomas M. Wojcik, would be joining AMG from BlackRock, Inc.
The appointment of Mr. Dalton as Chief Executive Officer and Mr. Horgen as President, along with the retention of Mr. Healey in the Executive Chairman role, was an approach that the Board of Directors determined to be in the best interests of the Company and its stockholders, and provides continuity of leadership and draws on the strengths and experiences of the Company’s most senior executives. The directors continue to serve as a source of strategic strength for the Company and for Mr. Dalton and Mr. Horgen in their new roles, bringing significant diversity in skills, experiences and perspectives.
Board Size: The Nominating and Governance Committee assesses the size and composition of the Board of Directors each year. Consistent with our Corporate Governance Guidelines, the Nominating and Governance Committee believes that our Board of Directors'Directors’ current size of ten is appropriate, given the size and complexity of the Company and the markets in which we operate. Over the last 20 years, the Board of Directors' size has ranged from five to ten directors, a range the Nominating and Governance Committee believes has served the Company and its stockholders well. Consistent with this historical approach, there are currently eight directors serving on the Board of Directors.
Executive Sessions of Non-managementNon‑Executive Directors: Our non-managementnon‑executive directors regularly meet in scheduled executive sessions without management present. In accordance with the charter of the Nominating and Governance Committee and the By-laws,By‑laws, Mr. Ryan, the Chair of the Nominating and Governance Committee, also serves as the Lead Independent Director, responsible for calling and chairing the executive sessions, including during the annual Board of Directors offsite, and communicating with Mr. Healey, the Chairman of the Board of Directors and the Company’s Chief Executive Officer.
Board and Committee Self-Assessments:Self‑Assessments and Individual Director Assessments: We recognize the critical role that Board of Directors and committee evaluations play in ensuring the effective functioning of our Board of Directors.Directors, including in assessing candidates for directorship. To this end, the Lead Independent Director, supported by our Nominating and Governance Committee, oversees the annual self-assessmentself‑assessment of the Board of Directors and of each committee of ourthe Board of Directors' committees also annually conducts a self-assessment.Directors. Directors assess performance and consider various structural and procedural considerations, including the annual selection process for director nominees and
communications and interactions with management generally. The Nominating and Governance Committee periodically reviews the format of the Board of Directors and committee self-assessmentself‑assessment processes to ensure that actionable feedback is solicited on the operation of the Board of Directors and director performance. The Nominating and Governance Committee also oversees annual individual director assessments as part of the recommendation process for director nominees. The table set forth below provides a general overview of the annual self-assessmentself‑assessment and director assessment processes.
Board and Committee |
Self-Assessments and Individual Director Assessments
Questionnaire | • Evaluation questionnaire solicits director feedback on a variety of procedural and substantive topics | |
Executive Session | • Executive session discussion of Board and committee self-assessments led by | |
Individual Director Assessments | ||
•Individual director assessments support an annual evaluation of the Board’s composition to ensure that our Board as a whole continues to reflect the appropriate mix of skills and experience | ||
Board Summary | •Summary of Board and committee self-assessments results presented by | |
Feedback Incorporated | • Policies and practices updated as appropriate, as a result of director feedback | |
Chief Executive Officer Evaluation: The Lead Independent Director oversees an annual performance evaluation of our Chief Executive Officer. As part of this assessment, the Lead Independent Director solicits director feedback on a variety of performance considerations. The Lead Independent Director then synthesizes the directors'directors’ feedback and discusses the results with our Chief Executive Officer in a one-on-oneone‑on‑one meeting. The Lead Independent Director reports on the results of the evaluation at an executive session of the Board of Directors.
Director On‑Boarding and Training: When a new non‑executive director joins the Board of Directors, we provide an orientation program that includes personal briefings by senior management on the Company’s operations, strategic plans, financial statements, governance, and key policies and practices. New directors also undergo in‑depth training on the work of each committee of the Board of Directors. Throughout their tenure on the Board of Directors, each director is expected to maintain the necessary knowledge and information to perform his or her responsibilities as a director. To assist the directors in understanding the Company and its industry and maintaining the level of expertise required for directors, the Company may, from time to time, offer Company‑sponsored continuing education programs or presentations, including sessions on select topics during the annual Board of Directors offsite. Additional training is also provided when a director assumes a leadership role, such as becoming the chair of a committee.
Leadership Structure:The Board of Directors currently combinesseparates the role of Chairman of the Board of Directors withfrom the role of Chief Executive Officer, and thisthrough the position of Executive Chairman, established in 2018. This leadership structure is further enhanced by the active involvement of the Lead Independent Director. The BoardCompany does not have a fixed policy with respect to the separation of Directors regularly reviews this structure, and continues to believe that the combinedoffices of the Chairman of the Board and Chief Executive Officer, roles,but regularly reviews the structure and believes that the Executive Chairman role, together with a strong Lead Independent Director, is an appropriate and effective leadership structure for the Company. A combined ChiefCompany at this time. The appointment of Mr. Healey as Executive OfficerChairman retains an experienced Chairman who has
unparalleled knowledge of AMG’s business and Chairman focuses leadership, responsibilityoperations and accountabilityis a widely recognized leader in a single person, and facilitates efficient and frequent communication betweenthe asset management industry. In this role, Mr. Healey continues to chair meetings of the Board of Directors and management. coordinate the agenda, in consultation with our Lead Independent Director and our Chief Executive Officer, and continues to guide the Company’s strategic direction.
The Lead Independent Director position provides for effective checks and balances to ensure the exercise of independent judgment by the Board of Directors and the ability of the independentnon‑executive directors to work effectively in the board setting.
The Company initiated the Lead Independent Director position in 2004, and Mr. Harold J. Meyerman, a former director, served in that role from its inception through the beginning of 2015. Mr. Ryan assumed the role in February 2015 and continues to serve as the Company'sCompany’s Lead Independent Director. Mr. Ryan was selected as Lead Independent Director given his excellent qualifications, including his extensive executive management experience, particularly in previous chief executive officer roles at several public and private companies, as well as his current role as Chief Executive OfficerChairman of Press Ganey Holdings, Inc., a NASDAQ-listed company. As Chief Executive Officer,Holdings. Given Mr. Healey brings unparalleled knowledge of the Company's business and operations to his role as Chairman. Mr. Healey is a widely recognized leader in the asset management industry. Mr. Healey joined the Company as a start-up venture, and for over twenty years, his strategic vision and leadership have shaped the Company and driven its long-term success. Similarly, given Mr. Ryan'sRyan’s service to our Board of Directors for over a decade, including service on all of the committees and as chair of several committees during his tenure, the Board of Directors believes that his extensive knowledge of (and participation in the execution of)execution) of the Company'sCompany’s corporate strategy over the long-term,long term, along with his executive management experience outside of AMG, position him as an effective and strong Lead Independent Director.
Recognizing the importance of the Lead Independent Director position to the Company, in 2010 the Board of Directors amended the By-laws to further enhance the responsibilities of the position, providing that the Lead Independent Director would perform many of the functions that an independent chairman would perform. The Lead Independent Director'sDirector’s principal responsibilities include: serving as a key source of communication between the independentnon‑executive directors, the Executive Chairman and the Chairman and Chief Executive Officer; ensuring the flow of appropriate information to and among independentnon‑executive directors; leading, with the assistance of the Nominating and Governance Committee, the Board of Directors'Directors’ annual self-assessmentself‑assessment process and annual performance evaluation of the Chairman and Chief Executive Officer; and coordinating the agenda for and leading executive sessions and meetings of the independentnon‑executive directors.
Lead Independent Director Responsibilities |
• Board leadership:Provides leadership to the Board and to the non-executive directors, including in | • Board governance | |||
| • Board discussion items:Works with the Chairman to propose major discussion items for the | |||
• Leadership of executive sessions:Leads quarterly executive sessions of the Board | • CEO evaluation:Leads the annual performance evaluation of the | |||
• Additional executive sessions:May call additional meetings of the | • Stockholder communications:Available for direct communication with | |||
The Board of Directors will continue to review its leadership structure, and although there are no current plans to do so, the Board of Directors may change its structure in the future if it believes that doing so would be in the best interests of the Company and its stockholders.
Risk Oversight: It is a key responsibility of our Executive Chairman, andour Chief Executive Officer, our President, and Chief Operating Officer, Chief Financial Officer and Treasurer, our General Counsel and other members of our senior management team to identify, assess and manage the Company'sCompany’s exposure to risk. The Board of Directors plays an important role in overseeing management'smanagement’s performance of these functions. The Board of Directors has approved the charter of the Audit Committee, which provides that one of the primary responsibilities of the Audit Committee is the discussion of the Company'sCompany’s financial risks and steps management has taken to monitor and control such risks, including with respect to risk assessment and risk management policies. The Audit Committee regularly discusses with management and the Company'sCompany’s independent auditors the Company'sCompany’s risk assessment and risk management processes, including major risk exposures, risk mitigants, and the design and effectiveness of the Company'sCompany’s processes and controls to prevent and detect fraudulent activity. Furthermore, the Audit Committee and the Board of Directors as a whole receive regular reports from management and our independent auditors on prevailing material risks and the actions being taken to mitigate them, including reports regarding the Company'sCompany’s business and operations. Management also reports to the Audit Committee and the Board of Directors regarding enhancements made to our risk management processes and controls in light of evolving market, business, regulatory and other conditions, including those related to environmental, social and governance (“ESG”) factors, including privacy and data security.
TheCorporate Environmental, Social and Governance Responsibility: We believe that sound corporate citizenship and attention to governance and environmental principles are essential to our success and that of our Affiliates. We are committed to operating with integrity, contributing to the local communities surrounding our global offices, promoting diversity and inclusion, developing our employees and being thoughtful stewards of natural resources. We are also focused on the security of our data and safeguarding
our clients’ privacy. Our Board of Directors recognizes that environmental, socialprovides oversight of these ESG topics, and governance ("ESG") factors could potentially impactis committed to supporting the Company's business and operations. Our Affiliates also consider ESG factors, and eightCompany’s efforts to operate as a sound corporate citizen. We have a cross‑functional Sustainability Committee with oversight responsibility of our Affiliates are signatoriespolicies and operational controls of environmental, health and safety, and social risks. The Sustainability Committee includes members of our executive management team and reports to the United Nations PrinciplesBoard of Responsible Investing (UNPRI),Directors at least annually. We believe that an integrated approach to business strategy, corporate governance and corporate citizenship creates long‑term value. The following summary highlights certain of our policies and initiatives in these areas. To learn more, please see the “Responsibility” section of our website at www.amg.com/responsibility.html.
In 2018, in furtherance of our ongoing commitment to serving our local communities through philanthropy, the Company made a global network committed$20 million one‑time matching gift to advance scientific research in amyotrophic lateral sclerosis (ALS) and develop effective treatments for people with ALS, by helping to establish The Sean M. Healey and AMG Center for ALS at Mass General. This matching gift honored Mr. Healey, our long‑time leader, and initiated a broader fundraising effort including a grant from The AMG Charitable Foundation, as well as gifts from Mr. Healey, other AMG employees, partners, and other individuals and organizations. The Healey Center will provide meaningful support to research professionals and dedicated physician‑scientists working together to find a cure for ALS and deliver personalized care and greatly increased access to therapies for people with the developmentdisease, benefiting people with ALS both locally and globally. This gift reflects AMG’s commitment to supporting non-profit organizations in our communities and to fostering a culture of a more sustainable global financial system.philanthropy and sound corporate citizenship among our employees and peers.
Related Person Transaction Oversight: Pursuant to its charter, the Audit Committee is responsible for reviewing any possible related person transaction identified by management or other directors and, in accordance with this authority, has determined that there have been no related person transactions requiring disclosure under Item 404(a) of Regulation S-KS‑K other than those discussed below under the caption "Other“Other Matters—Related Person Transactions."”
Policies and Procedures Regarding Related Person Transactions: Under the Company'sCompany’s written policy regarding related person transactions, the Audit Committee must approve all "related“related person transactions."” A related person transaction is any transaction that is reportable by the Company under paragraph (a) of Item 404 of Regulation S-KS‑K in which the Company or one of its wholly-ownedwholly owned subsidiaries or majority-ownedmajority‑owned Affiliates is or will be a participant and the amount involved exceeds $120,000 and in which any director, nominee for director, executive officer, any person known to the Company to be a beneficial owner of 5% or more of its voting securities or an immediate family member of any of the foregoing has or will have a direct or indirect material interest. Pursuant to the policy, potential related person transactions are reported to the General Counsel who evaluates the potential transaction to determine whether it is a potential related person transaction. If it is, the General Counsel reports the potential transaction to the Audit Committee for review. The policy also authorizes the Chair of the Audit Committee to ratify, rescind or take any such other action required with respect to any related person transaction not previously approved or ratified under the policy that comes to the General Counsel'sCounsel’s attention. The policy sets forth the standards of review to be considered in deciding whether to approve or ratify related person transactions.
In addition, the Audit Committee has considered and adopted standing pre-approvalspre‑approvals under the policy for limited transactions with related persons. Pre-approvedPre‑approved transactions include (i) employment as an executive officer, if the related compensation is approved (or recommended to the Board of Directors for approval) by the Compensation Committee; (ii) any compensation paid to a director if the compensation is consistent with the Company'sCompany’s director compensation policies and is required to be reported in the Company'sCompany’s proxy statement under applicable compensation disclosure requirements; (iii) any transaction with another company at which a related person'sperson’s only relationship is as an employee (other than an executive officer) or director or beneficial owner of less than 10% of that company'scompany’s equity, if the aggregate amount involved does not exceed the greater of $1,000,000 or 2% of that company'scompany’s total annual revenue; (iv) any charitable contribution, grant or endowment by the Company or the Company'sCompany’s charitable foundation to a charitable organization, foundation or university at which a related person'sperson’s only relationship is as an employee (other than an executive officer) or director,, if the aggregate amount involved does not exceed the greater of $1,000,000 or 2% of such charitable organization'sorganization’s total annual receipts; (v) any transaction where the related person'sperson’s interest arises solely from the ownership of the Company'sCompany’s common stock and all holders of the Company'sCompany’s common stock received the same benefit on a pro rata basis, such as dividends; (vi) any transaction involving a related person where the rates or charges involved are determined by competitive bids; and (vii) any service provided by the Company to any related person, provided that such service is in the ordinary course of business and on substantially the same terms as those prevailing at the time for comparable services provided to non-relatednon‑related persons.
Prohibition Against Hedging Transactions: Pursuant to the Company’s insider trading policy, all directors, officers and employees of the Company and its subsidiaries, including spouses and immediate family members of such persons, are prohibited from engaging in short sales or any other form of hedging transaction involving Company securities. This prohibition also applies to any other economically equivalent transaction by any such individuals that would result in a net short exposure to the Company. We believe our anti‑hedging policy further aligns our directors’ and our officers’ interests with those of our stockholders.
Compensation Committee Interlocks and Insider Participation:The members of the Compensation Committee during fiscal year 20152018 include those individuals set forth above under "Compensation Committee," along with Mr. Harold J. Meyerman, who served as a member of the Board of Directors and the Compensation Committee until January 2015.“Compensation Committee.” No person who served as a member of the Compensation Committee during 20152018 has been an officer or employee of the Company or has been involved in any related person transactions. No executive officer of the Company serves on the compensation committee or board of directors of another company that has an executive officer that serves (or served during 2015)2018) on the Company'sCompany’s Compensation Committee or Board of Directors.
Engagement with Our Stockholders: Since our inception as a public company, we have maintained an active engagement with our stockholders, meeting with them extensively throughout the year as part of our investor outreach.outreach, and we have a history of integrating stockholder feedback into our corporate governance practices and our executive compensation program design. In 20152018 and 2016 year-to-date,2019 year‑to‑date, we held approximately 450over 200 meetings with our stockholders, including a majority of our top 30 stockholders, to discuss the Company'sCompany’s performance and prospects, as well as trends affecting the investment management industry. We also launched acontinued our specific outreach effort with our institutional investors in 2015 to discuss corporate governance issuestopics affecting the Company.Company as well as our philosophy and practices relating to our executive compensation program. This involved discussions (mainly in-person) with the corporate governance teams at our largest
stockholders, as well as many others, representing in aggregate approximatelyover one-third of our voting shares. Across our stockholder base, there is a wide variety of viewpoints regarding corporate governance issues affecting the Company; topics covered in these meetings included:
Stockholder Engagement |
Participants | Types of Engagement | Topics Covered |
• Members of the Board of Directors • Executive Management • Investor Relations | • Investor conferences • Earnings conference calls • One‑on‑one Investor conference calls and one‑on‑one Investor meetings • Outreach, calls and meetings with Investors’ corporate governance departments • Annual votes on director elections and Say‑on‑Pay | • Strategic and financial performance and goals, and business initiatives • Board composition: qualifications, skills and leadership structure |
| ||
•
| ||
| ||
Executive compensation policies and design | ||
• Regulatory considerations • Risk management, including cybersecurity | ||
• Corporate governance trends, including ESG considerations | ||
Stockholder and Interested Party Communications: Stockholders and other interested parties may communicate directly with the Board of Directors orand the Lead Independent Director as follows:
Stockholder Communications |
Board of Directors | Any communications to the full Board of | David M. Billings Affiliated Managers Group, Inc. 777 South Flagler Drive West Palm Beach, Florida 33401-6152 | ||
Lead Independent Director | A stockholder or other interested party | Patrick T. Ryan, Director c/o Affiliated Managers Group, Inc. 777 South Flagler Drive West Palm Beach, Florida 33401-6152 | ||
Availability of Corporate Governance Documents: We maintain a Company website that includes, among other items, the Corporate Governance Guidelines; the Code of Business Conduct and Ethics applicable to all directors, officers and employees; the Code of Ethics applicable to our Chief Executive Officer, President and Chief Financial Officer, and other senior financial officers; the Insider Trading Policy and Procedures applicable to all directors, officers and employees; and the charters for the Audit, Compensation, and Nominating and Governance Committees. This information is available on the "Investor Relations"“Investor Relations” section of our website,www.amg.com, under "Corporate Governance,"“Corporate Governance—Policies, Procedures and Guidelines,” or for the Committee charters under "Board“Corporate Governance—Board of Directors,"” but is not incorporated by reference into this Proxy Statement. If we make any substantive amendment to the Code of Ethics or grant any waiver, including any implicit waiver, from a provision of the Code of Ethics to certain executive officers, we are obligated to disclose the nature of such amendment or waiver, the name of the person to whom any waiver was granted, and the date of waiver on our website or in a report on Form 8-K.8‑K.
Information Regarding Executive Officers of the Company
The name, age (as of April 1, 2016)2019) and positions of each of our named executive officers, as well as a description of their business experience and past employment during at least the last five years, are set forth below:
Compensation Discussion and Analysis
Executive Summary
This section provides discussion and analysis of our executive compensation program, including the elements of executive compensation, the 20152018 compensation results, the rationale and process for reaching these results, and our compensation governance policies. The compensation results discussed will be those of our Chairman and Chief Executive Officer, Sean M. Healey,Nathaniel Dalton, and our four other named executive officers.
The Compensation Committee designs the executive compensation program to align management incentives with long-termlong‑term stockholder interests. The executive compensation structure reflects this philosophy, with the substantial majority of total annual compensation comprising variable performance-based incentive awards, and with the significant majority in the form of long-term deferred equity.variable performance‑based incentive awards. The Committee'ssignificant majority of these variable performance‑based incentive awards are in the form of equity incentive awards, with delivery of more than half of these awards tied to the achievement of rigorous pre‑established performance targets. The Committee’s compensation determinations for 20152018 reflected this approach,its long‑term philosophy of aligning pay with performance, and also relied on a formal assessmentassessments of our financial results, stockAMG’s performance and strategic accomplishments for the year and over the long term, on both a relative and absolute basis (the "Performance Assessment"“Performance Assessments”).
In conducting thisthe Performance Assessment,Assessments, the Committee recognized the Company's exceptionalCompany’s performance for both the year and over the long term. Led by Mr. Healey andThese results occurred against the other named executive officers, againstbackdrop of a challenging market backdrop we achieved record operating results across all aspects ofenvironment for active asset managers. Despite our business and executed on key strategic initiatives, including strong relative and long-term organic growth, as well as over $1.2 billion in capital deployed, including over $800 million in new Affiliate investment activity, meaningfully enhancing AMG's strategic position in attractive products and key markets around the world. While AMG's long-termlong‑term stock performance, remains exceptional relative to both the S&P 500®Committee recognized the stock price decrease for 2018 and our Peer Group (defined below),over the trailing 3‑ and 5‑year periods, reflecting elevated market volatility, particularly in the fourth quarter of 2018, and financial and operating performance that was impacted by the broadly negative returns across asset classes. Notwithstanding these challenges, the Committee also consideredrecognized the challenging market environment forcontinued focus on building relationships with prospective new Affiliates, the assetformation of new strategic partnerships to enhance AMG’s product set and expand distribution capabilities, including the partnership with Nordea Asset Management to deepen coverage of European and Latin American clients, and AMG’s new office in Japan. The Committee further recognized the management team’s active pursuit of opportunities to improve efficiencies and reduce Company expenses (including both operating expenses and interest expense, lowering AMG’s cost of capital), while also working with a number of Affiliates to assist in aligning their business infrastructures with foreseeable opportunities and against evolving industry in 2015, which resulted in a median stock price declinedynamics. Alongside these strategic and operational accomplishments, the senior management team also successfully executed on the Board of -26% across publicly-traded traditional and alternative asset managers and contributed to the decline in AMG's stock priceDirectors’ long‑term succession plan, following an unexpected CEO transition during the year, on both a relative and absolute basis.year. As a result of this transition, Mr. Healey, Mr. Dalton and consistent with ourMr. Horgen all moved into new positions, which the Compensation Committee took into account in the final compensation program philosophy of aligning pay withdeterminations for the year. Recognizing the Company’s stock performance and its financial results over the year, total 20152018 compensation for our named executive officers declined relative to the prior year, includingyear—consistent with our compensation program philosophy of aligning pay with long‑term performance. This included a 19%‑44% decrease in the variable performance-basedperformance‑based incentive compensation ("Performance-Based(“Performance‑Based Incentive Compensation"Compensation”) forgranted to our Chief Executive Officer, as well as a decrease in the combined total compensation of our Executive Chairman and our Chief Executive Officer.Officer (each of whom performed in the Chief Executive Officer role during a portion of 2018) of ‑29% and a decrease in the combined total compensation of our named executive officers as a group of more than ‑20%.
Throughout this Compensation Discussion and Analysis we discuss the 20152018 compensation results for our named executive officers, which include equity awards granted in February 20162019 in recognition of 20152018 performance, and exclude equity awards granted in January of 20152018 in recognition of 20142017 performance, to better demonstrate how we evaluate and compensate our named executive officers. These amounts differ from the compensation reported in the Summary Compensation Table because SEC rules governing the reporting of compensation in that table require equity awards to be reported in the fiscal year of grant, even where the awards are intended to compensate executives for performance in a prior year. Please refer to the "Executive“Executive Compensation Tables"Tables” and "Equity“Equity Grant Policy"Policy” sections of this Proxy Statement for additional information.
Overview of Our Executive Compensation Program Philosophy
The Compensation Committee has structured our executive compensation program over the long term to further several core objectives, which include the following:
Attracting, retaining and motivating key members of senior management—especially Mr. Healey, a widely recognized leader inmanagement
Closely aligning executive compensation with our performance and accomplishments for the asset management industry whose visionyear and leadership have shapedover the Company and driven its long-term successlong term
• |
|
Compensating executives based on a combination of Company performance—on both a relative and absolute basis—and individual performance
Avoiding incentives that might encourage excessive risk-takingrisk‑taking
Routinely reviewing and evolving our compensation program to incorporate feedback from stockholders and best practices into our executive compensation program design
These objectives inform the design of our compensation program, which includes the following components:
Awarding fixed and variable Performance-BasedPerformance‑Based Incentive Compensation in an appropriate mix to align management incentives with stockholder value creation
Performing market comparisons to ensure that our compensation is in line with that of our Peer Group
Implementing strong compensation governance practices within a robust corporate governance framework
Stockholder and Proxy Advisory Firm Feedback and Surveys
At our 2015 Annual Meeting, 97% of stockholder votes cast were in favor of our named executive officer compensation, reflecting strong support for our executive compensation program design and its demonstrated linkage of pay-for-performance. To ensure that our Board of Directors, including the Compensation Committee, is apprised of stockholder and proxy advisory firm views, senior management regularly meets with and surveys these constituents regarding our executive compensation program including as noted in the "Engagement with Our Stockholders" sectionand governance matters. As part of this Proxy Statement. In 2015,process, we metconduct regular outreach initiatives with senior representatives from Institutional Shareholder Services, Inc. and Glass, Lewis & Co., in addition to the corporate governance teams at our largest stockholders.stockholders, as well as representatives from major proxy advisory firms.
At our last Annual Meeting, over 94% of stockholder votes cast were in favor of our named executive officer compensation, reflecting strong support for our executive compensation program design and its demonstrated linkage of pay‑for‑performance. This high level of support followed a comprehensive outreach to stockholders to discuss a broad range of topics, including executive compensation and governance matters. During this outreach, senior management attended in‑person meetings with top institutional investors and major proxy advisory firms, in several of which our Compensation Committee Chair, Jide Zeitlin, participated. The Compensation Committee considered the feedback from this outreach, and input of these parties as it made its final compensation determinations for the year. As such, and as with each prior year, this year's compensation determinations reflectimplemented meaningful enhancements to our compensation program.program in 2017.
This engagement continued after our 2018 Annual Meeting, and during that ongoing process stockholders expressed support for the 2017 enhancements, including the following:
Following our 2018 Annual Meeting, we continued our engagement with stockholders and proxy advisory firms on our executive compensation program and governance practices. This outreach included meetings with institutional investors over the course of the year, as well as multiple in‑person meetings with major proxy advisory firms. Our Compensation Committee Chair, Jide Zeitlin, once again attended multiple meetings with top institutional investors and a major proxy advisory firm. The collective feedback from this outreach was taken into account and is reflected in further enhancements made to our corporate governance practices and compensation program design this year, were designedas well as in the Committee’s final compensation determinations.
The Compensation Committee recognizes that in enhancing the compensation program, stockholder input is critical for ensuring the continued alignment of management and stockholder interests, and the Committee's compensation determinationCommittee promotes an active process for our named executive officers and further evolve equity award structures.
of stockholder engagement throughout the year. Our management team continues to communicate with our largest stockholders and proxy advisory firms, and to follow developments in their methodologies and analyses to ensure that the Company and our Board of Directors remain apprised of current and potential future developments.
Named Executive Officer Annual Compensation Determination Process
The Compensation Committee'sCommittee’s annual compensation process begins during Committee meetings early in the fiscal year and continues throughout the year, with periodic reviews of the Company'sCompany’s financial performance on both a relative and absolute basis and progress on various strategic objectives, as well as discussions regarding the principles and continuing effectiveness of the compensation program. The Committee, including, in particular, the Committee Chair, attends numerous meetingsmeets with its independent outside executive compensation consulting firm, Thomas E. Shea & Associates, LLC ("Shea & Associates"(our “Compensation Consultant”), at key points throughout the year to consider the compensation of the peer companies set forth in the "Market“Market and Industry Comparison"Comparison” section of this Proxy Statement (our "Peer Group"“Peer Group”), and potential structures for incentive awards. The Committee considers the components of the compensation program (including the mix of compensation elements, market-levelmarket‑level compensation and our compensation governance practices) in analyzing the extent to which the program furthers the Committee'sCommittee’s objectives of aligning compensation with stockholder value creation while retaining and motivating our executives. As discussed above, the Committee also seeks feedback from stockholders and proxy advisory firms in an ongoing engagement cycle, and takes that feedback into account in both enhancing the compensation program design, as well as in the Committee’s final compensation determinations for the year.
As part of this process, Shea & Associatesour Compensation Consultant regularly provides ourthe Compensation Committee with comprehensive data, including Peer Group long-term equity incentive awards and total direct compensation, along with analyses of the Company'sCompany’s historical pay levels relative to our Peer Group. Shea & AssociatesOur Compensation Consultant also provides
projections regarding general executive compensation market trends among other S&P 500® companies, as well as the universe of financial institutions that are relevant competitors for executive talent.
Following year-end,year‑end, the Compensation Committee conducts a comprehensive Performance AssessmentAssessments of the Company'sCompany’s accomplishments during the year and over the long term, on both an absolute basis and relative to our Peer Group, and considers the individual contributions of each of the members of our senior management team. As part of the continuous evolution of our compensation program and in response to the stockholder engagement process discussed above, the Committee made further enhancements this year which were designed to increase transparency of the Committee's compensation determination process for our named executive officers and to further evolve equity award structures.our executive compensation program design. In January 2016,2019, based upon the Performance Assessment,Assessments, the Compensation Committee made final performance-basedperformance‑based incentive cash and equity grantaward determinations for our named executive officers.
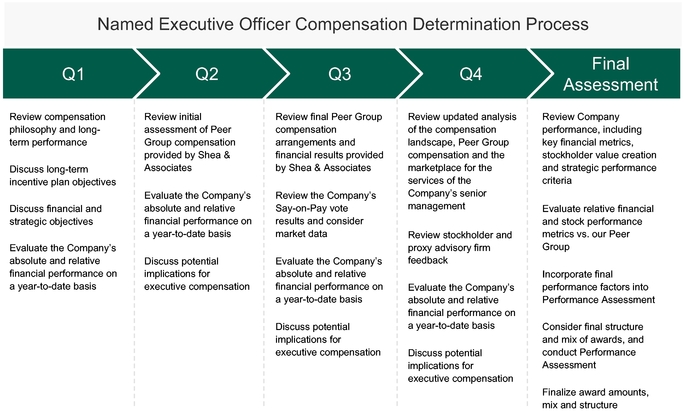
2015 Performance Highlights
The Company's performance highlights for 2015 include record financial results and growth across key areas of our business, as well as the successful execution of key strategic initiatives to position us for future growth.
The Company's results were particularly strong when viewed against the challenging environment for asset managers in 2015. Ongoing uncertainty regarding the U.S. Federal Reserve's intentions with respect to interest rates; dislocation in commodity prices and emerging markets, particularly China; and concerns regarding a global macroeconomic slowdown contributed to significant market volatility, particularly in the second half of the year, which in turn drove rising risk aversion among investor clients. Across the investment management industry, market declines impacted revenue from asset-based fees (as seen in the -2% decline, year-over-year, among AMG's Peer Group), and lower risk appetite resulted in net outflows of actively-managed client assets. AMG generated strong gross sales during the year, and while our net client cash flows as a percentage of AUM were -0.5%, AMG's Peer Group average organic decay was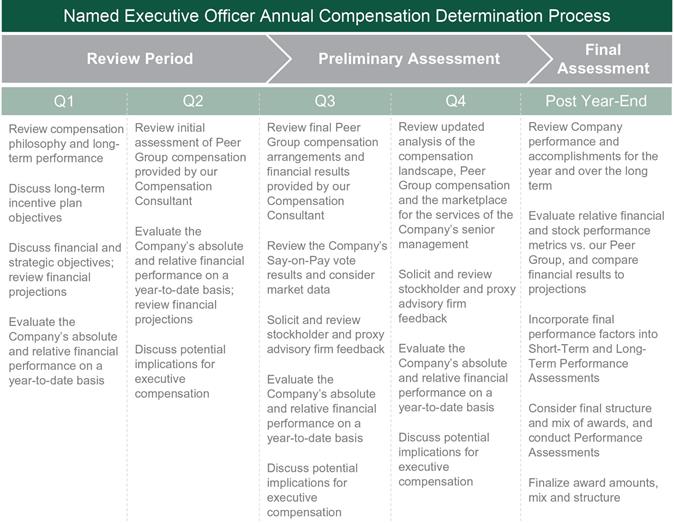
-1.4% during 2015. Similarly, stockholder returns across the sector were also weak, with a median stock price decline of -26% across publicly-traded traditional and alternative asset managers. Against this difficult backdrop, the strong execution of AMG's business strategy, and the resultant record levels achieved across key financial metrics, were particularly noteworthy. While AMG's stock price declined during 2015 along with the asset management sector broadly, the Compensation Committee noted that AMG's shareholder return for the calendar year ending December 31, 2015 is a single data point for a specific calendar-year time period, and views AMG's returns over longer-term periods to be more meaningful metrics in evaluating the Company's performance. Notwithstanding AMG's stock price decline during 2015, AMG's stock price has increased approximately 10% in 2016 year-to-date, outperforming 100% of our Peer Group.
Named Executive Officer Compensation Determination Approach
The Compensation Committee designs the executive compensation program to align pay with performance. The following Exhibit 2 provides an overview of our compensation structure, which was used to determine 20152018 salary and Performance-BasedPerformance‑Based Incentive Compensation ("(“Total Direct Compensation"Compensation”) for our Chairman and Chief Executive Officer and also provided the basis for determining the Total Direct
Compensation of our other named executive officers. This structure reflects the Committee'sCommittee’s executive compensation program philosophy of closely aligning management incentives with long‑term stockholder interests, with the substantial majority of total annual compensation comprising variable performance-based incentive awards, and the significant majorityTotal Direct Compensation in the form of deferredvariable performance‑based incentive awards, the significant majority of which are in the form of equity closely aligning management incentivesincentive awards, and with long-term stockholder interests.delivery of more than half of these equity incentive awards tied to the achievement of rigorous pre‑established performance targets. Consistent with our compensation program approach of aligning pay with performance, our most senior named executive officers typically receive the highest percentage of equity and performance-based awards inclosest alignment with the targeted ranges.
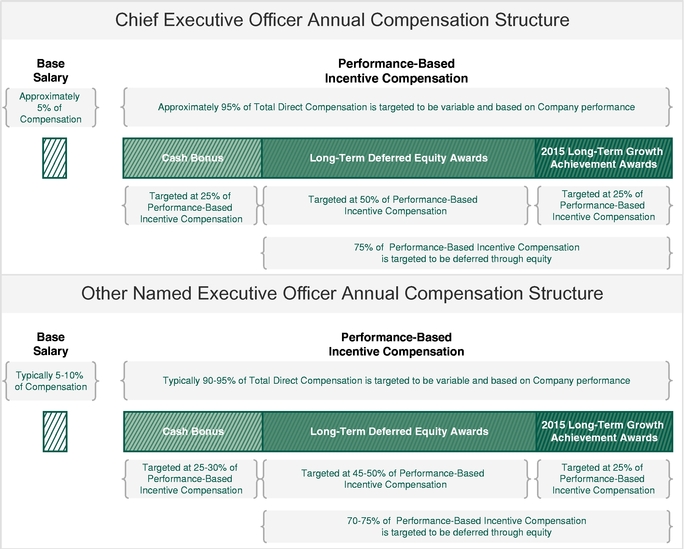
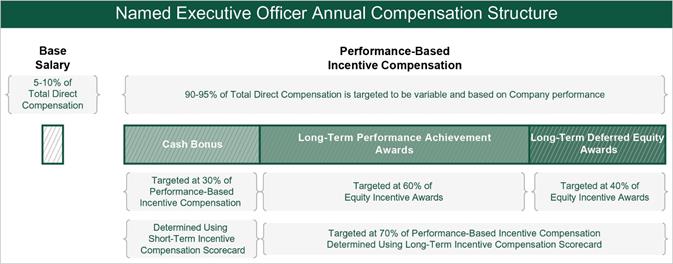
• Base salary is a small portion of Total Direct Compensation • All compensation other than base salary is variable and performance‑based, determined using the Incentive Pool and awarded in amounts based on formal Performance Assessments | • Equity incentive awards with rigorous performance conditions are the largest component of total NEO compensation • Cash is a significantly smaller portion of Total Direct Compensation than equity incentive awards |
The following is a summary of the key features of the Compensation Committee'sCommittee’s compensation determination process, including recenta significant number of enhancements designedmade over the last several years in response to increase transparency of the Committee's compensation determination processstockholder and proxy advisory firm feedback and to further evolve equity award structures, supportingsupport our compensation program philosophy of aligning pay with performance:
Further enhanced the rigor of our Long-Term Growth Achievement Awards: The 2015 Long-Term Growth Achievement Awards, granted in February 2016 in recognition of 2015 performance, include the following enhancements:
– | Performance Assessment for Short‑Term Incentive Compensation determinations: |
▪ | Continued use of a Short‑Term Incentive Compensation performance scorecard to evaluate contributions and progress over the year in two equally weighted categories: (i) business initiatives and (ii) financial performance |
▪ | The assessment produces a score that is applied to a maximum bonus amount, set based on peer and market data, to produce a formulaic cash bonus award amount |
– | Performance Assessment for Long‑Term Incentive Compensation determinations: |
▪ | Continued use of a Long‑Term Incentive Compensation scorecard, with weighted assessment of our financial results, stock performance and strategic accomplishments for the year and over the long term |
▪ | The weightings of the two quantitative categories (financial results and stock performance) accounted for two‑thirds of the overall score, with only one‑third weightings for the more subjective strategic factors |
▪ | Expanded disclosure includes weightings in each sub‑category, to show the linkage between the assessment and the awarded amounts, and to increase transparency |
▪ | Added formal consideration of ESG factors to the assessment, to promote responsible management of environmental, social and governance practices, and the pursuit of meaningful initiatives to continuously improve AMG’s corporate stewardship |
▪ | The overall weighted score is applied to the annual cap on Performance‑Based Incentive Compensation (less the maximum cash bonus award), to produce a formulaic equity award amount |
Allocations of Performance‑Based Incentive Compensation reflect a significant proportion of performance‑based equity awards:
– | A significant majority of Performance‑Based Incentive Compensation is in the form of equity incentive awards: Approximately 70% of CEO Performance‑Based Incentive Compensation was in the form of equity incentive awards, which is in the top quartile of our Peer Group |
– | A substantial majority of the equity incentive awards have transparent performance targets: Of the equity incentive awards, 60% were targeted to be performance awards, granted in the form of Long‑Term Performance Achievement Awards, with three‑year cliff vesting and delivery further subject to rigorous pre‑established performance targets; this allocation was the largest component of our CEO’s Total Direct Compensation and is above our Peer Group average proportion |
Long‑Term Performance Achievement Awards use a return on equity target, measured over a single three‑year performance period:
– | Long‑Term Performance Achievement Awards are only deliverable if we meet target return on equity levels: |
▪ | Return on equity targets align management incentives with the strategic goals of not only growing earnings, but also effective stewardship of stockholder capital; the three‑year measurement period takes into account retained earnings from previous years and indicates the effectiveness of stockholder capital reinvestment |
▪ | This metric is used by other S&P 500® financial services companies as an objective measure of management’s effectiveness at using stockholder equity to generate earnings and to encourage responsible long‑term planning |
– | Use of a single forward‑looking performance period: |
▪ | Use of a single forward three‑year measurement period, with cliff vesting three years from issuance; any portion of the award that will not be delivered following the performance period will be forfeited |
▪ | This award structure was introduced for the 2017 performance year, and was retained for the 2018 performance year following positive stockholder feedback on our revised award design |
Short‑Term Performance‑Based Incentive Compensation Determination Process
For 2018 cash bonus award determinations, the Compensation Committee set a maximum cash bonus for all Named Executive Officers, including the Chairman andour Chief Executive Officer: Consistent withOfficer of $4.0 million, a reduction over the prior year cap of $4.5 million, to promote relative pay alignment. Following year‑end, the Compensation Committee applied an annual limitconducted a Short‑Term Incentive Performance Assessment to produce a score based on Mr. Healey's Performance-Based Incentive Compensation ("CEO Performance-Based Incentive Compensation") equalthe weighted categories discussed below, which was applied to the lessermaximum cash bonus to establish a cash bonus award amount. In conducting this assessment, the Committee evaluated contributions and progress over the year in two equally weighted categories, assessing business initiatives and financial performance, and reviewing the factors set forth in the table below. These include quantitative financial factors, as well as qualitative factors that recognize key company and individual achievements. This Performance Assessment process links compensation to performance, as awards are determined after the fiscal year-end based on a review of $25actual performance for the year.
Exhibit 3
The Compensation Committee’s assessment recognized the significant business accomplishments achieved over the year, which occurred in a challenging environment for active asset managers and a transition period for the management team. During this period, the senior management team delivered on its commitment to returning capital to stockholders, with an additional increase in our quarterly cash dividend and $490 million or 40%in share repurchases in 2018, and lowered our cost of capital and extended the duration of our borrowings through the refinancing of our credit facilities and entered into foreign currency derivative contracts to access lower interest rates. Further, the Committee recognized the continued focus on cultivating strong relationships with prospective new Affiliates in a challenging transaction environment and on the formation of new strategic partnerships to enhance AMG’s product set and expand distribution capabilities, including the recent partnership with Nordea Asset Management to deepen coverage of European and Latin American clients, and our new office in Japan. The Committee also recognized the management team’s active pursuit of opportunities to improve efficiencies and support the positioning of Affiliates’ businesses for future
opportunities, a recent example of which is combining the investment team at Trilogy Global Advisors with GW&K Investment Management; and reducing Company operating expenses while also working with a number of Affiliates to assist in aligning their business infrastructures with foreseeable opportunities and against evolving industry dynamics.
In addition, the Committee noted the significant progress made in ESG initiatives over the year, under the guidance of our Sustainability Committee, including completing the Company’s first inventory and securing third‑party attestation of our Greenhouse Gas (GhG) Emissions, participation in the CDP Climate Change Information Request, and transitioning to renewable energy sources at multiple office locations. AMG also made a significant one‑time matching gift to establish The Sean M. Healey and AMG Center for ALS at Mass General, uniting world experts to revolutionize treatments and pursue a cure for ALS, reflecting AMG’s commitment to non-profit organizations in our communities and to fostering a culture of philanthropy and sound corporate citizenship among our employees and peers.
Alongside these strategic and operational accomplishments, the senior management team also successfully executed on the Board of Directors’ long‑term succession plan, which the Board initiated following an unexpected CEO transition during the year, with exceptional leadership efforts by Mr. Healey, who was appointed Executive Chairman during 2018, Mr. Dalton, who was appointed Chief Executive Officer and joined the Board of Directors during 2018, and Mr. Horgen, who was appointed President following the end of the Incentive Pool, which represented a maximum payout of $21.8 million to Mr. Healey. This amount also served as a cap on individual Performance-Based Incentive Compensation applicable to each named executive officer.
The Compensation Committee’s assessment also includes a comparison of our actual results against targets that are set based on projected performance levels reviewed during the Review Period, and are designed to align management incentives with stockholder value creation. These targets include Economic earnings per share and EBITDA margin (Adjusted EBITDA as a percentage of both Aggregate fees and of GAAP Revenue), which together track the maximum payout,efficiency, stability and growth of our earnings. The Compensation Committee recognized the mixed performance for the year against these targets, with Economic earnings per share of $14.50 for the year, relative to a projected level of $15.02, and an EBITDA margin of 18% on an Aggregate fee basis, which matched the target level, and 40% on a Revenue basis, relative to a projected level of 42%, resulting in a Financial Performance score of 40%. The assessment resulted in an overall weighted score of 50% and a formulaic cash bonus amount for our Chief Executive Officer of $2.0 million.
Exhibit 4
2018 Financial Results vs. Targets |
|
Financial targets used in the Short‑Term Incentive Compensation Performance Assessment are designed to align management incentives with stockholder value creation, and take into account factors known at the time. Actual results may be impacted by a number of external factors, including macroeconomic factors, market changes, and regulatory or political changes, as well as other factors such as share repurchases and new investments in Affiliates, that may not be anticipated and could significantly impact our business. In performing its assessment, the Compensation Committee recognizes that management must respond to these factors and may take that into account in its review of year‑end performance against targets. These financial targets are not intended to be
a prediction of the Company’s performance during the performance year or in any future period, and are not intended to provide investors or any other party with guidance about our future financial performance or operating results. See the “Forward‑Looking Statements” section of our Annual Report on Form 10‑K.
Long‑Term Performance‑Based Incentive Compensation Determination Process
Following year‑end, the Compensation Committee conducted its Long‑Term Incentive Compensation Performance Assessment, based on the Performance Assessment—a weighted categories discussed below, to establish the amount of the Long‑Term Incentive Compensation awards for 2018. In conducting this assessment, of ourthe Committee reviewed the Company’s financial results, stock performance and strategic accomplishments for the year and over the long term, on both a relative and absolute basis.
Performance-Based Incentive Compensation Determination Process
Following year-end, the Compensation Committee conducted its Performance Assessment, based on the weighted categories discussed below, to establish the final amount of Performance-Based Incentive Compensation for 2015. In conducting this assessment, the Committee reviewed the Company's financial results, stock performance and strategic accomplishments for the year and over the long term, on both a relative and absolute basis.
Exhibit 3
|
|
| ||||||
2015 Performance Assessment Results
The following Exhibit summarizes the key results that the Compensation Committee considered in its 20152018 Long‑Term Incentive Compensation Performance Assessment.Assessment, as well as the results of the Committee’s overall assessment. A more detailed description of each performance factor and the results of the Committee's overall assessment followfollows the Exhibit.
Exhibit 45
2018 Long-Term Incentive Compensation Performance Assessment | ||||||||||||
Key Financial and Operating Metrics Weighting: 33.3% | Stockholder Value Creation Weighting: 33.3% | Strategic Performance Criteria Weighting: 33.3% | ||||||||||
Relative Growth Rates (Weighting: 50% | ||||||||||||
•
|
Compound annual growth rates
Absolute Growth Rates
• Compound annual growth rates
| Relative Stock Performance
• Annual and long-term (measured over the trailing 1‑, 3‑ and 5‑year periods) stock performance
Absolute Stock Performance
| Investment Performance and Organic Growth Generation (Weighting: 30%) • Investment performance by Affiliates in areas of strategic focus, positioning AMG for future success in areas of strong client demand • Annual and long‑term organic growth from net client cash flows, both on an absolute basis and relative to AMG’s Peer Group New Investments Strategy, Pursuit of Strategic Initiatives and Global Distribution Enhancements
• Cultivation of relationships with prospective new Affiliates to position AMG for strong future growth; deployment of capital through investments in • Working with • Development of Capital Management (Weighting: 30%) • Effective balance sheet management to return capital to stockholders and ESG Strategies and Initiatives (Weighting: 10%) • Responsible management of environmental, social and governance practices; meaningful initiatives to continuously improve AMG’s corporate stewardship | |||||||||
Key Financial and Operating Metrics Score 40% | Stockholder Value Creation Score 0% | Strategic Performance Criteria Score 60% | ||||||||||
Overall Weighted Score 33.3% | ||||||||||||
Performance Category: Key Financial and Operating Performance Metrics (Weighted 33.3%)
The Compensation Committee'sCommittee’s Long‑Term Incentive Compensation Performance Assessment included a review of our key financial and operating metrics, on both a relative and absolute basis. The Committee noted our recordstrong long‑term results with allacross our key financial and operating metrics, increasingas well as the challenging environment for active asset managers. Our 2018 financial and operating results were impacted by industry‑wide client risk aversion and elevated market volatility, particularly in the fourth quarter, which produced broadly negative returns across asset classes. Our Aggregate fees for the year were relatively flat compared to the highest year-end levels in Company history, notwithstanding a challengingprior year and assets under management were lower, reflecting modestly negative flows for the year as well as the impact of elevated market environment.
volatility and foreign exchange rate changes. The Committee also reviewedrecognized that our year‑end GAAP results were largely impacted by a small number of one‑time items, including non‑cash impairment charges relating to two alternative Affiliates in 2018 and a one‑time gain in the compound annual growth rates of these financial metrics over the 1-, 3- and 5-prior year periods, which all remained strong. Together, these factors contributedrelating to the Committee's recognition of exceptional performance in this category.
Exhibit 5
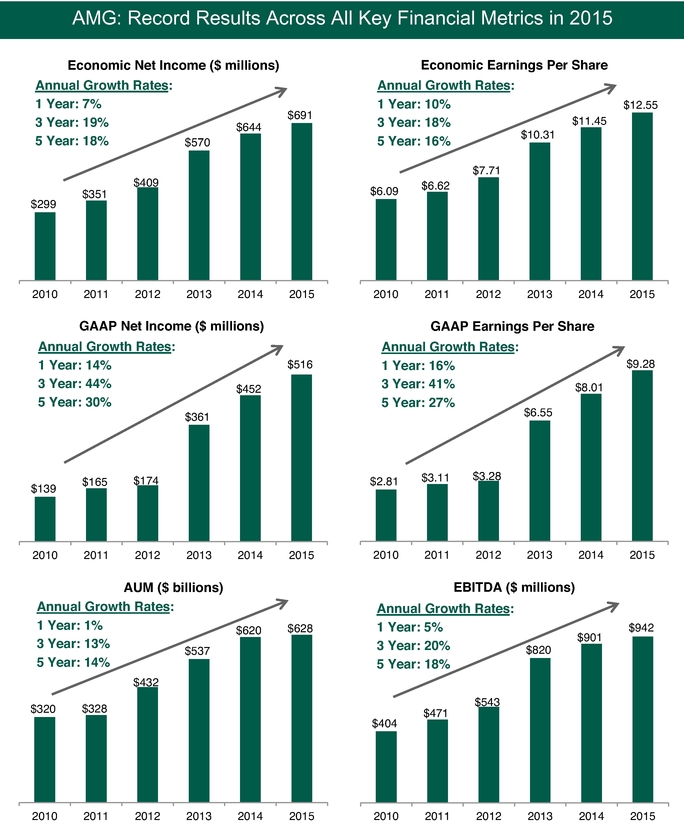
Note: 2015 year-end AUM is pro forma for investments which have since closed.
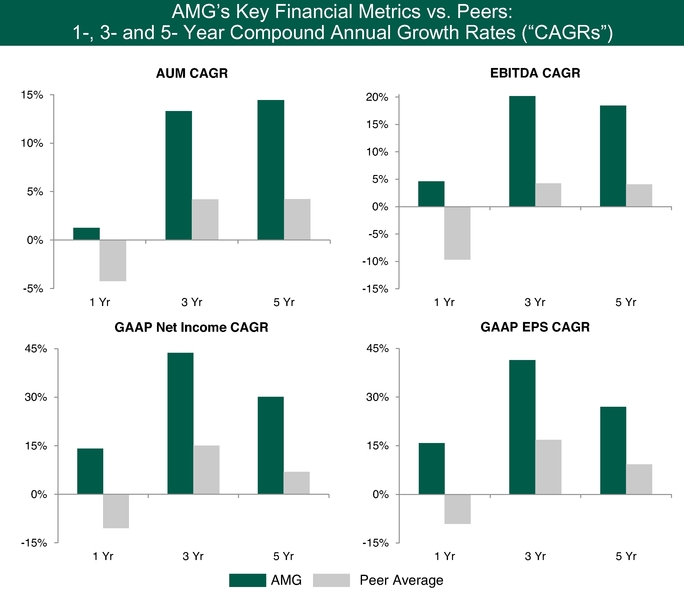
Note: The above chart includes both GAAP financial measurestax reform, as well as publicly reported adjustedAMG’s donation to establish The Sean M. Healey and AMG Center for ALS at Mass General. The following tables set forth the key financial results and growth rates reviewed by the Committee.

(1) | GAAP net income and GAAP earnings per share for 2018 are also shown as adjusted to add back impairment charges net of taxes totaling $265 million. |
Additional information on non-GAAP financial performance measures, including reconciliations to the most directly comparable GAAP measure, can be found in our Annual Report on Form 10-K under “Supplemental Financial Performance Measures.” Aggregate fees is an operating measure that consists of AMGthe total asset- and its peers. Peer EBITDA metrics are calculated using available company data and industry standard calculation methodologies.performance-based fees earned by all of our Affiliates, as further described in our Annual Report on Form 10-K.
AMG’s Key Financial and Operating Metrics vs. Peer Averages: 1-, 3- and 5-Year Compound Annual Growth Rates (“CAGRs”) | |
• AUM CAGRs of ‑12%, +6% and +6% for the 1‑, 3‑ and 5‑year periods, compared to Peer CAGRs of ‑7%, +4% and +3% for the same periods • GAAP earnings per share (diluted) CAGRs of ‑62%, ‑21% and -6% for the 1‑, 3‑ and 5‑year periods, compared to Peer CAGRs of +24%, +6% and +11% for the same periods • Adjusted EBITDA CAGRs of ‑14%, +1% and +3% for the 1‑, 3‑ and 5‑year periods, compared to Peer CAGRs of +4%, +3% and +4% for the same periods • Economic earnings per share CAGRs of ‑1%, +5% and +8% for the 1‑, 3‑ and 5‑year periods, compared to Peer CAGRs of +17%, +9% and +9% for the same periods | • Aggregate Fees CAGRs of ‑2%, +10% and +7% for the 1‑, 3‑ and 5‑year periods, compared to Peer CAGRs of +3% for each of these periods • GAAP net income CAGRs of ‑65%, ‑22% and ‑6% for the 1‑, 3‑ and 5‑year periods, compared to Peer CAGRs of +22%, +4% and +9% for the same periods • Economic net income CAGRs of ‑5%, +4% and +7% for the 1‑, 3‑ and 5‑year periods, compared to Peer CAGRs of +1%, +7% and +7% for the same periods |
The above table includes both GAAP financial measures as well as publicly reported adjusted financial measures of AMG and its peers. Peer EBITDA metrics are calculated using available company data and industry standard calculation methodologies. | |
Performance Category: Stockholder Value Creation (Weighted 33.3%)
The Compensation Committee'sCommittee’s Long‑Term Incentive Compensation Performance Assessment included a review of our annual and long-termlong‑term stock performance, on both a relative and absolute basis. The Committee noted our strong record of long-term stockholder value creation, with stock performance of +23%, +61%price decrease for 2018 and +99% over the trailing 3-, 5-3‑ and 10-year5‑year periods, respectively, significantly outpacingreflecting elevated market volatility, particularly in the increasefourth quarter of our Peer Group average over2018, and noted the trailing 5- and 10-year periods. Notwithstanding this exceptional long-term performance, the Committee also considered the -25% stock price decline in 2015 (versus the Peer Group average decline of -21%), reflecting the challenging market environment for the asset management industry, which contributed to the decline in AMG's stock pricerelative underperformance during the year, on both a relative and absolute basis.
Across the investment management industry, market declines impacted revenue from asset-based fees, and lower risk appetite resulted in net outflows of actively-managed client assets.same periods. Stockholder returns in 2018 were impacted across the sector, were generally weak, with astock prices declining ‑36% at the median stock price declineacross publicly traded traditional asset managers, relative to the ‑6% return generated by the S&P 500® index.
- | Stock price declined ‑52% in 2018, reflecting a challenging market environment for active asset managers and elevated market volatility, particularly in the fourth quarter, and trailed our Peer Group median and the S&P 500® (+3% and ‑6%, respectively) |
- | Stock performance of +135% over the trailing 10‑year period, outperforming our Peer Group median of +118%; stock price declined ‑38% and ‑54% over the trailing 3‑ and 5‑year periods, respectively, below our Peer Group median (+55% and +39%, respectively) |
Exhibit 7
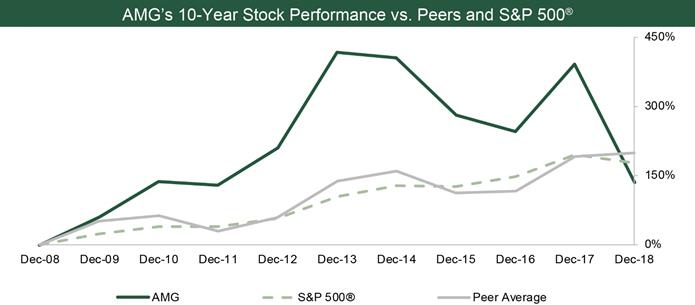
Market data as of -26% across publicly-traded traditional and alternative asset managers.December 31, 2018.
Exhibit 6
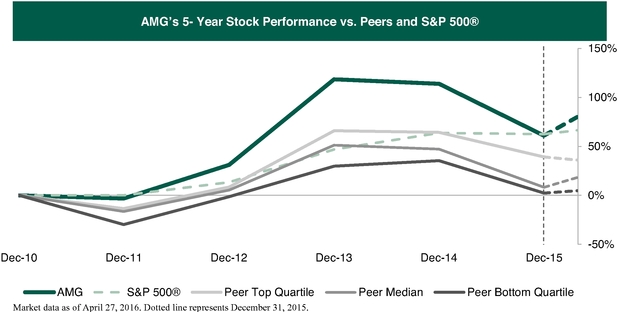
Performance Category: Strategic Performance Criteria (Weighted 33.3%)
The Long‑Term Incentive Compensation Performance Assessment included a review of the Company'sCompany’s execution on certain strategic performance criteria, including product performance and strategy, organic growth, global distribution, new Affiliate investments, strategic initiatives, and risk and capital management. The Compensation Committee noted the Company's significantCompany’s achievements in 2015, including meaningfully expanded capabilities across our global distribution platform, substantial capital deployed through accretive investments in new Affiliates,2018 and strong executionover the longer term, as further described below.
Capital Management and Pursuit of Efficiency Opportunities: The Committee reviewed our capital management strategy. The Committee's assessmentactivity and recognized exceptional performance across the majority of areasachievements in this performance category, as described further below.including the following:
Demonstrated commitment to returning capital to stockholders, with an increase in our quarterly cash dividend each year since its initiation, along with $490 million in share repurchases in 2018 and between $100 million and $300 million in repurchases targeted for the first half of 2019
Lowered our cost of capital and extended the duration of our borrowings through the refinancing of our credit facilities, and entered into foreign currency derivative contracts to access lower interest rates
Active review of business for opportunities to improve efficiencies and support the positioning of Affiliates’ businesses for future opportunities; for example, combining the investment team at Trilogy Global Advisor with GW&K Investment Management
Reducing operating expenses at AMG while also working with a number of Affiliates to assist in aligning their business infrastructures with foreseeable opportunities and against evolving industry dynamics
ESG Initiatives: The Committee noted the significant progress made in ESG initiatives, under the guidance of our Sustainability Committee, including completing our first inventory and securing a third‑party attestation of our GhG Emissions, participation in the CDP Climate Change Information Request, and transitioning to renewable energy sources at multiple office locations. The Committee also recognized the meaningful furtherance of AMG’s ongoing commitment to serving our local communities through philanthropy, with a significant one‑time matching gift to establish The Sean M. Healey and AMG Center for ALS at Mass General, uniting world experts to revolutionize treatments and pursue a cure for ALS, reflecting AMG’s commitment to fostering a culture of philanthropy and sound corporate citizenship among our employees and peers.
Investment Performance and Product Strategy: The Committee reviewed our execution and ongoing development of our active, return-orientedreturn‑oriented product strategy, especially in the areas of global equitiesequity and alternatives,alternative strategies, and recognized exceptional achievementssolid performance in this performance category, including the following:
Successful implementation of a differentiated product strategy relative to our Peer Group, whereinwith global equity and alternative strategies accounting for approximately 75% of AMG's earnings are generated by global equities and alternative strategies,the Company’s AUM. We believe these areas we believe to have outstanding secular growth prospects. The success of our strategic focus on attractive active, return-orientedreturn‑oriented product areas is further evidenced by the exceptionalstrong organic growth we have generated over the trailing 3-3‑ and 5-year5‑year periods, notwithstanding modestly negativeincluding positive net client cash flows in alternative and multi‑asset strategies during 2015, reflecting2018 against a backdrop of industry‑wide outflows in active equities
Enhanced our active, return‑oriented product set through the addition of new products as a result of the product development efforts at our Affiliates
New Affiliate Investments: The Committee reviewed our new Affiliate investment activity, including the overall volume of opportunities reviewed and the continued progress in relationship development with our core prospect universe, and recognized continued progress in this performance category in a challenging markettransaction environment, and muted investor risk appetiteincluding the following:
Continued excellent investment performance of our Affiliates' active return-oriented products, while taking into account the disparity in equity market beta between U.S. and non-U.S. markets (S&P 500® -1% in 2015 compared to the MSCI EAFE -3% and MSCI EM -17%)
Deployment of over $2 billion in aggregate transaction value over the last four years, enhancing our geographic diversity and enhance our overall existing product lineup
Organic Growth: The Committee reviewed our annual and long-termlong‑term net client cash flows, on both an absolute basis and relative to our Peer Group, and recognized exceptional long-termstrong long‑term performance in this category, notwithstanding a challenging market environment for active products during 2015:2018:
Strong longWhile‑term organic growth, with net client cash flows were modestly negative on an absolute basis, we generated strong organic growth on a relative basis during 2015, which was aboveover the Peer Group averagepast decade of over $115 billion into active equity products and alternative strategies
AMG is one of the year5 largest global managers of active, return‑
Strategic Initiatives and lower risk appetite resulted in net outflows of actively-managed client assets
Exhibit 7
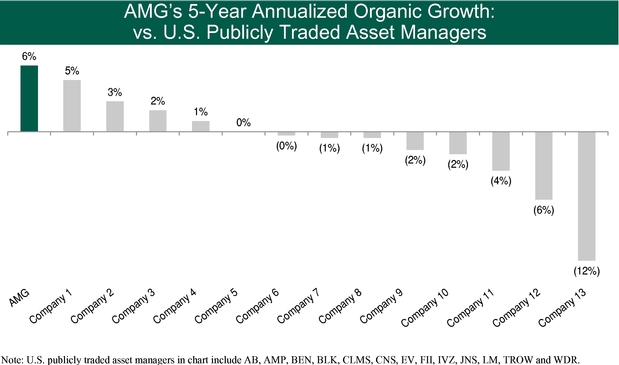
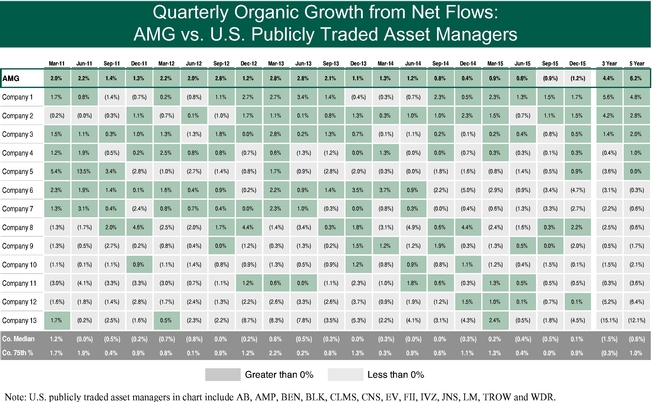
Expanding Global Distribution:Distribution Capabilities: The Committee reviewed our progress in expanding our global institutional and U.S. retail distribution platforms, and recognized exceptional achievementssolid performance in this performance category, including the following:
Formation of new strategic partnerships to enhance AMG’s product set and expand distribution capabilities, including the recent partnership with Nordea Asset Management to deepen coverage of European and Latin American clients
Opening of a new office in Japan to build strategy for executing on substantial opportunities in that market
Ongoing momentum in our global distributionGlobal Distribution strategy, with investments in expanded capabilities resulting in the generation of significant new business as we, together with our Affiliates, continue to build relationships with the largest and most sophisticated clients around the world
Won client investment mandates in every coverage region of our global platform duringover the year
Ongoing focus on enhancing the breadth and depth of our global clientinstitutional coverage across global regions and retail coverage in the U.S.
Enhanced our institutional platform in Asia and Europe
New Affiliate Investments: The Committee reviewed our new Affiliate investment activity, including the value and number of transactions completed, the overall volume of opportunities reviewed and the continued progress in relationship development with our core prospect universe, and recognized exceptional achievements in this performance category, including the following:
|
| |
|
| |
|
|
Capital Management: The Committee reviewed our capital management activity and recognized exceptional achievements in this performance category, including the following:
20152018 Named Executive Officer Compensation Results
For 2015,2018, the Compensation Committee set the size of the Incentive Pool at 6% of Adjusted Economic net income, resulting in an Incentive Pool of approximately $54.4$56.0 million. CEO Performance-BasedPerformance‑Based Incentive Compensation was capped at a maximum payout equal to the lesser of $25$17.5 million or 40% of the Incentive Pool, which represented a cap of $21.8$17.5 million for our Chief Executive Officer, and his cash bonus award was capped at a maximum of $4.0 million. Equity incentive awards were limited to Mr. Healey. Thisthe capped amount alsoof Performance‑Based Incentive Compensation less the maximum cash bonus, resulting in a maximum of $13.5 million of equity incentive awards for our Chief Executive Officer. These annual caps served as a cap on individual Performance-Basedthe basis for determining formulaic award payouts, using the scores of the two Performance Assessments. In the case of the cash bonus, the score of the Short‑Term Incentive Compensation Performance Assessment was applied to the maximum bonus amount for our Chief Executive Officer, to determine a formulaic cash bonus amount. In the case of the equity incentive awards, the score of the Long‑Term Incentive Compensation Performance Assessment was applied to the annual capped amount of Performance‑Based Incentive Compensation, less the applicable maximum cash bonus, to each named executive officer. Thedetermine a formulaic equity incentive award amount for our Chief Executive Officer. For purposes of the Performance Assessment—a weighted assessmentAssessments, the Committee considered Mr. Dalton as serving in the role of our financial performance, stock performance and strategic accomplishmentsChief Executive Officer for the full year, as a practical expedient and overin recognition of his prior role as President and Chief Operating Officer and his exceptional leadership efforts during the long term, on both a relative and absolute basis—yielded results which established the final amount of each named executive officer's Performance-BasedCEO transition.
The Short‑Term Incentive Compensation. TheCompensation Performance Assessment recognized the achievement of key strategic goals, including our exceptionalsignificant business accomplishments during the year, which occurred in a challenging environment for active asset managers that produced mixed performance for the year against the financial performance targets, and a year of transition for the management team. During this period, the senior management team delivered on its commitment to returning capital to stockholders, executed on its capital management strategies, progressed on building relationships with record resultsprospective new Affiliates, pursued new strategic partnerships, expanded our Global Distribution platform, reduced operating expenses and advanced on significant ESG initiatives. The Committee also recognized the successful execution on the Board of Directors’ long‑term succession plan, which the Board initiated following an unexpected CEO transition during the year. This assessment produced a formulaic cash bonus award for our Chief Executive Officer of $2.0 million, representing 50% of the $4.0 million maximum amount.
The Long‑Term Incentive Compensation Performance Assessment recognized significant achievements in 2015an environment that remained challenging for active asset managers, and against the backdrop of significant declines across all key financial metrics,most asset classes for 2018. However, the Committee also recognized that our stock price was negative for 2018, as well as successful product strategy execution, strongthe trailing 3‑ and 5‑year periods, reflecting market volatility and industry head‑winds for active asset managers over this period. This assessment produced a formulaic Long‑Term Incentive Compensation award for our Chief Executive Officer of $4.5 million, representing 33.3% of the $13.5 million maximum amount. The Committee’s allocation for these equity incentive awards was 40% in the form of Long‑Term
Deferred Equity Awards and 60% in the form of Long‑Term Performance Achievement Awards, consistent with the targeted allocations.
The annual cap on Performance‑Based Incentive Compensation for our Executive Chairman was set at the lesser of $10.0 million or 20% of the Incentive Pool. The Committee applied the results of its Performance Assessments, and recognized the significant contributions of Mr. Healey during the year, particularly during the CEO transition, and the continued leadership during the ongoing transition and succession planning, and the fact that Mr. Healey was in the Chief Executive Officer role for the first part of the year. The Committee determined to grant a mix of awards for our Executive Chairman that included a larger portion of cash relative to the other named executive officers and long-term organic growthequity incentive award allocations that included a greater proportion of time‑vesting awards, given his health diagnosis and his new positon. In keeping with the trend of prior years, the notional value of the cash award granted to our Executive Chairman declined ‑17% year‑over‑year, with a total decline of ‑41% over the past five years. This process produced a cash bonus award of $2.975 million and equity incentive awards of $3.175 million, with $1.905 million in the form of Long‑Term Deferred Equity Awards and $1.270 million in the form of Long‑Term Performance Achievement Awards. The total compensation of our Executive Chairman declined ‑43% compared to 2017, with a significant relative reduction expected for the 2019 performance year, as the senior management team continues to evolve. The Executive Chairman’s compensation structure on a forward basis will reflect (i) Mr. Healey’s role as Executive Chairman for a full calendar year (as compared to 2018 when he served as Chief Executive Officer for part of the year), (ii) market comparisons for the role and (iii) award mix and levels that further the Committee’s objectives of aligning compensation with stockholder value creation and retaining and motivating executives.
For determining the compensation of Jay C. Horgen for 2018, when he served as Chief Financial Officer, the Committee used an annual cap on Performance‑Based Incentive Compensation set at the lesser of $10.0 million or 20% of the Incentive Pool. The Committee then applied the results of its Performance Assessment, and recognized Mr. Horgen’s significant contributions during a challenging performance year, and his central and significant new Affiliate investment activity. While our long-term stock performance has been exceptional relative to both the S&P 500® and our Peer Group, the Committee also considered our stock price decline
role in 2015 on both an absolute basis and relative to our Peer Group, reflecting a challenging market environment.
The weighted Performance Assessment across the three performance categories resulted in a Performance-Based Incentive Compensation payout tosupporting Mr. Healey and Mr. Dalton in managing the business. The assessment also recognized the continuing evolution of $14.0his responsibility set and his increasingly broad leadership role at the Company, and the Committee’s compensation program philosophy of designing incentive structures that retain and motivate key management team members, and promote alignment with long‑term stockholder interests. The Committee awarded Mr. Horgen a cash bonus award of $1.65 million 64%and equity incentive awards of $3.5 million. The Committee’s allocation for the maximum amount, reflectingequity incentive awards was 40% in the Committee's recognitionform of Long‑Term Deferred Equity Awards and 60% in the exceptional performance across eachform of Long‑Term Performance Achievement Awards, consistent with the financial performance and strategic accomplishments categories, and impacted by the Company's short-term stock performance. Mr. Healey'stargeted allocations.
CEO Performance-Based Incentive Compensation Declined –44% Reflecting AMG’s Compensation Program Philosophy of Aligning Pay with Performance |
Our Chief Executive Officer’s Performance‑Based Incentive Compensation decreased by 19% from‑44% relative to that awarded to the Chief Executive Officer in the prior year, consistent with our compensation program philosophy of aligning pay with performance. Of Mr. Healey's 2015 Total Direct Compensation, 95% was Performance-Based Incentive Compensation, comprising a cash bonus (27%This reduction followed declines in each of Performance-Based Incentive Compensation), with the remainder awarded in the formlast five years for an overall reduction of long-term equity grants, thereby closely aligning executive compensation with long-term stockholder interests. Mr. Healey's base salary has remained unchanged at $750,000 for the past decade.
Of the $14.0 million of Performance-Based Incentive Compensation awarded to Mr. Healey for 2015 performance, the Committee allocated 27% as a cash bonus and 73% in the form of long-term deferred equity awards vesting over multiple years, consistent with the targets established by the Compensation Committee. As in several prior years, the Committee targeted a proportion of long-term deferred equity awards which would be meaningfully higher than the Peer Group average, thereby aligning Mr. Healey's interests more closely with stockholders than the average Peer Group company. Of the long-term deferred equity awards, approximately one-third was in the form of 2015 Long-Term Growth Achievement Awards and the remainder was in the form of Long-Term Deferred Equity Awards, consistent with the Committee's targeted allocation.
In the case of Mr. Dalton, President andour Chief Operating Officer, and Mr. Horgen, Chief Financial Officer and Treasurer, the Compensation Committee determined a Performance-Based Incentive Compensation payment of $8.4 million for the former and $6.5 million for the latter. As compared to the prior year, the Performance-BasedExecutive Officer’s Performance‑Based Incentive Compensation of both Mr. Daltonapproximately ‑65% since 2013. The aggregate total compensation of our Executive Chairman and Mr. Horgenof our Chief Executive Officer (who each performed in the Chief Executive Officer role during a portion of 2018) declined 19% for 2015.
Consistent with‑29% relative to performance year 2017, and total compensation of our named executive officers as a group declined more than ‑20% over the targets established bysame period. These outcomes demonstrate the impact and effectiveness of compensation program enhancements of the past several years to further tighten the link between pay and performance, as well as the Compensation Committee, of Mr. Dalton's 2015 Total Direct Compensation, 94% was Performance-Based Incentive Compensation, comprising a cash bonus representing 28% of Performance-Based Incentive Compensation,Committee’s consistent and the remainder awarded in the form of long-term equity grants. Mr. Dalton's base salary remained unchanged at $500,000. Of the $8.4 million of Performance-Based Incentive Compensation awardedongoing attention to Mr. Dalton, the Committee allocated 72% in the form of long-term deferred equity awards vestingconcern over multiple years. Of the long-term deferred equity awards, approximately one-third was in the form of 2015 Long-Term Growth Achievement Awardscompensation levels and the remainder was in the form of Long-Term Deferred Equity Awards, consistentalignment with the Committee's targeted allocation.
Consistent with the targets established by the Compensation Committee, of Mr. Horgen's 2015 Total Direct Compensation, 93% was Performance-Based Incentive Compensation, comprising a cash bonus representing 30% of Performance-Based Incentive Compensation, with the remainder awarded in the form of long-term equity grants. Mr. Horgen's base salary remained unchanged at $500,000. Of the $6.5 million of Performance-Based Incentive Compensation awarded to Mr. Horgen, the Committee allocated 70% in the form of long-term deferred equity awards vesting over multiple years. Of the long-term deferred equity awards, approximately one-third was in the form of 2015 Long-Term Growth Achievement Awards and the remainder was in the form of Long-Term Deferred Equity Awards, consistent with the Committee's targeted allocation.
long‑term stockholder interests. The following table summarizes and compares total Performance-Based Incentive Compensation awardedcompensation for performance year 20152018 for all of our named executive officers:
| | | 2015 Performance-Based Incentive Compensation | | | ||||||||||||||||||||||||||||||||||||||||||||||
|---|---|---|---|---|---|---|---|---|---|---|---|---|---|---|---|---|---|---|---|---|---|---|---|---|---|---|---|---|---|---|---|---|---|---|---|---|---|---|---|---|---|---|---|---|---|---|---|---|---|---|
| | | Change in Performance- Based Incentive Compensation from Prior Year | |
|
|
|
|
| 2018 Performance-Based Incentive Compensation |
|
|
|
|
|
|
|
|
| ||||||||||||||||||||||||||||||||
Name | Salary | Cash Bonus | Long-Term Deferred Equity Awards | 2015 Long-Term Growth Achievement Awards | Total 2015 Performance- Based Incentive Compensation | Total 2014 Performance- Based Incentive Compensation |
| Salary ($) |
|
| Cash Bonus ($) |
|
| Long-Term Deferred Equity Awards ($) |
|
| Long-Term Performance Achievement Awards ($) |
|
| Total Performance- Based Incentive Compensation ($) |
|
| All Other Compensation ($) |
|
| Total Compensation Earned ($) |
| |||||||||||||||||||||||
Nathaniel Dalton |
|
| 650,641 |
|
|
| 2,000,000 |
|
|
| 1,800,000 |
|
|
| 2,700,000 |
|
|
| 6,500,000 |
|
|
| 37,894 |
|
|
| 7,188,535 |
| ||||||||||||||||||||||
Sean M. Healey | $ | 750,000 | $ | 3,850,000 | $ | 6,575,000 | $ | 3,575,000 | $ | 14,000,000 | (19)% | $ | 17,200,000 |
| 750,000 |
|
|
| 2,975,000 |
|
|
| 1,905,000 |
|
|
| 1,270,000 |
|
|
| 6,150,000 |
|
|
| 263,279 |
|
| 7,163,279 |
| |||||||||||
Nathaniel Dalton | $ | 500,000 | $ | 2,300,000 | $ | 3,950,000 | $ | 2,100,000 | $ | 8,350,000 | (19)% | $ | 10,250,000 | |||||||||||||||||||||||||||||||||||||
Jay C. Horgen | $ | 500,000 | $ | 1,950,000 | $ | 2,940,000 | $ | 1,600,000 | $ | 6,490,000 | (19)% | $ | 8,000,000 |
|
| 500,000 |
|
|
| 1,650,000 |
|
|
| 1,400,000 |
|
|
| 2,100,000 |
|
|
| 5,150,000 |
|
|
| 45,685 |
|
|
| 5,695,685 |
| |||||||||
Andrew Dyson | $ | 403,550 | $ | 1,538,230 | $ | 1,445,000 | $ | 780,000 | $ | 3,763,230 | (17)% | $ | 4,543,413 | |||||||||||||||||||||||||||||||||||||
Hugh P. B. Cutler |
|
| 400,000 |
|
|
| 800,000 |
|
|
| 480,000 |
|
|
| 720,000 |
|
|
| 2,000,000 |
|
|
| 34,979 |
|
|
| 2,434,979 |
| ||||||||||||||||||||||
David M. Billings | $ | 400,000 | $ | 1,400,000 | $ | 585,000 | $ | 315,000 | $ | 2,300,000 | N.M. | $ | 2,271,000 |
|
| 400,000 |
|
|
| 1,100,000 |
|
|
| 240,000 |
|
|
| 360,000 |
|
|
| 1,700,000 |
|
|
| 33,554 |
|
|
| 2,133,554 |
| |||||||||
N.M. denotes "not meaningful" as Mr. Billings joined the Company in June 2014.
The Performance-BasedPerformance‑Based Incentive Compensation amounts provided to the named executive officers for the 2015 fiscal2018 performance year set forth in the above table differ from the amounts disclosed in the Summary Compensation Table. Equity awards granted in recognition of performance in 20152018 were granted in February 2016,2019, and do not appear in the Summary Compensation Table, as SEC rules governing the reporting of equity compensation in the Summary Compensation Table require equity awards to be reported in the fiscal year of grant, even when the awards are intended to compensate executives for performance in a prior year. The equity awards granted in February 20162019 are included as part of total 2015 Performance-Based Incentive Compensation2018 compensation in the above table, to better demonstrate how we evaluate and compensate our named executive officers. Similarly, equity awards granted in recognition of performance in 20142017 were granted in January 20152018 and appear in the Summary Compensation Table for 2015,2018, in accordance with these reporting rules. Mr. Billings joined the Company on June 30, 2014, and therefore his total 2014 Performance-Based Incentive Compensation represents such compensation for the six-month period since he joined mid-year.
The decrease in Mr. Healey'sour Chief Executive Officer’s total 20152018 compensation relative to the prior year was consistent with our compensation program philosophy of aligning pay with performance. Theperformance, as reflected in the following tables reflect compensation alignment with our stock price decline for the year, despite exceptional long-term stock performance and record financial results, including an increase in Economic earnings per share over the prior year to the highest level in Company history.chart.
Exhibit 8
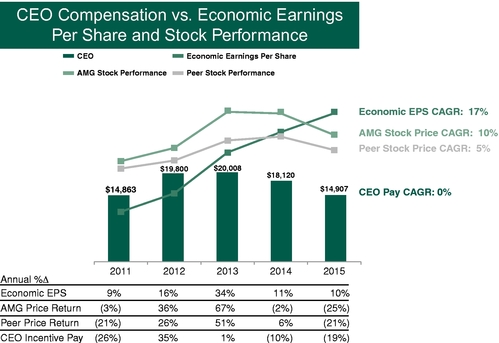
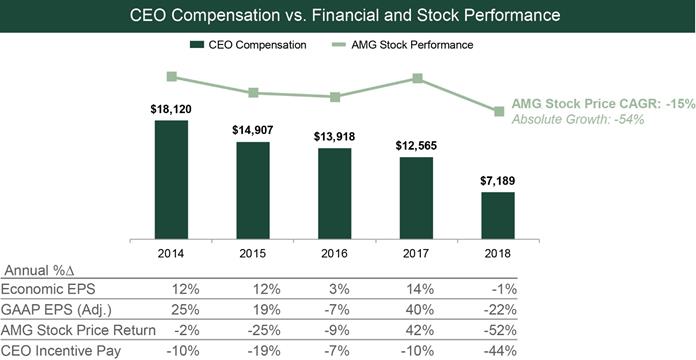
Note: Stock price performance and CAGRs calculated beginning on 12/31/2010.2013. AMG 20152018 CEO Compensationcompensation includes long-term equity incentive awards earned for performance during 2015;2018; see the "Executive“Executive Compensation Tables"Tables” section of this Proxy Statement for information regarding differences from the Summary Compensation Table.2018 GAAP Earnings per share in the table above is adjusted to add back impairment charges net of taxes totaling $265 million.
Total 2018 compensation reductions followed declines in each of the last five years, for an overall reduction of ‑64% for our Chief Executive Officer compensation since 2013 and similar significant reductions across the named executive officer group, demonstrating consistent and ongoing attention to compensation levels and the effectiveness of the compensation program.
Additional information on non-GAAP financial performance measures, including reconciliations to the most directly comparable GAAP measure, can be found in AMG’s Annual Report on Form 10-K under “Supplemental Financial Performance Measures.”
Each of the key elements of named executive officer compensation for 20152018 is summarized below:
Exhibit 9
Elements of Named Executive Officer Compensation | ||||||||
Base Salary | |
| | • Base salary was
| ||||
Variable Performance‑ Based Incentive Compensation | |
| | • Total
| ||||
Cash Bonus Awards | | • Significantly smaller portion of variable | |
•
| ||||
Long‑Term Deferred Equity Awards | | • Restricted stock unit awards vesting ratably over four years | |
| ||||
Long‑Term Performance Achievement Awards | |
| | • 60% of Mr. Dalton’s and Mr. Horgen’s Long‑Term Incentive Compensation and the largest component of their overall compensation • Awards cliff vest at the end of three years, but are
- If
-
- If
| ||||
Other Compensation | | • Medical, dental, life and disability insurance; 401(k)
| | • Less than 1% of our CEO’s total | ||||
The following charts summarize the relative mix of Mr. Healey's 2015Dalton’s 2018 Total Direct Compensation, comprising salary and Performance-Based Incentive Compensation, is summarized incompare the following charts, along with a comparisonallocation of the proportion of Performance-BasedPerformance‑Based Incentive Compensation awarded as long-term deferred equity incentive awards relative to our Peer Group:
Exhibit 10
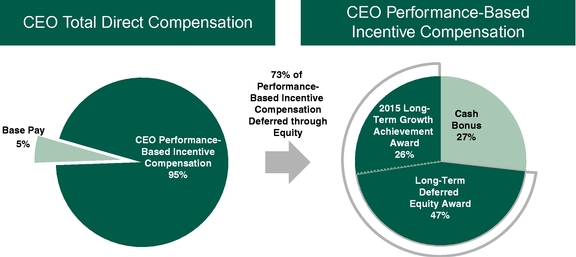
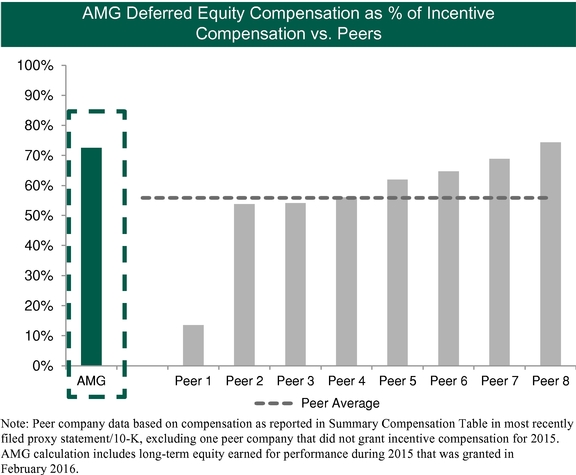
The
2018 Mix of CEO Compensation Elements & Peer Comparison |


Note: Peer company data based on compensation as reported in Summary Compensation Committee believesTable in most recently filed proxy statement or annual report; AMG calculation includes equity incentive awards earned for performance during 2018 that 2015 Performance-Based Incentive Compensation appropriately rewarded our executives for exceptional financial performance and strategic accomplishments, while recognizing our negative stock performance for the year against the backdrop of awere granted in February 2019.
challenging market environment for the asset management industry. The awards closely aligned management incentives with long-term stockholder interests, provided a basis to retain and motivate our senior executives, and reflected market compensation levels for executives at companies within our Peer Group. The Performance-Based Incentive Compensation awarded in 2015 reflects our commitment to align pay with performance, with the significant majority of compensation in the form of deferred equity-based awards—approximately one-third of which was in the form of a performance-based stock option award with delivery tied to earnings growth measured on a relative and absolute basis—and only a small portion of total compensation in cash.
Elements of Executive Compensation
The compensation for our named executive officers comprises the following elements, designed to further the Compensation Committee'sCommittee’s core objectives.
Base Salary: In determining base salary levels for our named executive officers, the Compensation Committee takes into account the executive'sexecutive’s scope of responsibility, performance and salary history, as well as consistency within our salary structure. In addition, the Committee annually reviews the base salaries paid to executive officers of other public companies in our Peer Group. Because theThe Committee believes that Performance-BasedPerformance‑Based Incentive Compensation—including both cash compensation as well as equity-basedequity‑based compensation—should constitute the substantial majority of compensation paid to our named executive officers, we target the level ofofficers. The base salary at the medianlevel for comparable positions in our Peer Group. In total, base salaries and other fixed compensation for the named executive officers typically represent less than 10% of their total compensation and less than 5% for our Chairman and Chief Executive Officer. Base salary levels for our Chairman and Chief Executive Officer and for our President and Chief Operating Officer havehas remained unchanged for overmore than a decade.
Performance Performance-Based‑Based Incentive Compensation: The Compensation Committee typically grants both equity and cash awards as part of the overall performance-basedperformance‑based award package for each named executive officer. The Committee believes that deferred compensation in the form of equity-basedequity‑based awards provides long-termlong‑term incentives that further the objectives of increasing stockholder value and retaining our senior management team. Given the Committee'sCommittee’s objective of aligning compensation with increases in stockholder value, the Committee generally intends that the substantial majority of total compensation be equity-based,equity‑based, and grants of equity-based interestsequity‑based awards are, therefore, generally a larger portion of the variable Performance-BasedPerformance‑Based Incentive Compensation than cash bonuses. Furthermore, since the Committee believes the tenure and continuity of management is a strategic imperative to creating stockholder value over the long term, in granting equity awards, the Committee ensures that awards have a long-termlong‑term focus, vest over multiple years and, in certain cases,for at least a majority of these equity awards, are also subject to additional pre-established, measurablepre‑established performance targets.
Performance-BasedPerformance‑Based Incentive Compensation is awarded based on the results of the Compensation Committee's Performance Assessment (which weights key aspectsCommittee’s assessment of AMG's short- and longer-term historical performance, and considers the individual named executive officer'sofficer’s contributions to that performance),the Company’s short‑ and long‑term performance, as well as the expected contribution of the named executive officer to our future performance. The Committee considers the relative mix of equity-basedequity‑based compensation awards against the performance-basedperformance‑based cash compensation awarded to each named executive officer in any particular year. The Committee further considers each executive'snamed executive officer’s existing equity ownership, including the relative size and structure of historical grants and the portions of awards that are not yet vested. In addition, the Committee considers each named executive officer’s position and performance, the performance, incentivecash and equity-basedequity‑based compensation levels of the Company and our individual named executive officers relative to our Peer Group, as well as the comparative levels of equity ownership of individual officers at such companies.
The Compensation Committee uses the Incentive Pool to governas the awarding ofbasis for determining all Performance-BasedPerformance‑Based Incentive Compensation, which includes all compensation other than base salaries and any perquisites, and is established as a percentage of Adjusted Economic net income (calculated on a pre-tax, pre-compensation basis).income. Economic net income and Economic earnings per share are used by our
management and Board of Directors as our principal financial performance benchmarks, including as measures for aligning executive compensation with stockholder value. As compared to GAAP net income and earnings per share, Economic net income and Economic earnings per share primarily adjust for non-cash items resulting fromSee our acquisition of interests in new or existing Affiliates. Economic net income and Economic earnings per share also allow for greater comparability to our Peer Group because the majority of the companies in our Peers Group do not acquire interests in new or existing Affiliates as frequently as we do. See pages 21 through 23 of our 20152018 Annual Report on Form 10-K,10‑K, under "Supplemental“Supplemental Financial Performance Measures,"” for further detail on the usage and calculation of Economic net income and Economic earnings per share, including a reconciliation to the most directly comparable GAAP measure.
Other Elements of Compensation: We provide a 401(k) Profit Sharing Plan for all employees and generally contribute a percentage of compensation to such plans. We also provide other benefits such as medical, dental and life insurance and disability coverage to all eligible employees.
Perquisites: Our perquisite compensation is in the lowest quartile of our Peer Group, as weWe use only certain perquisite tools deemed appropriate by the Committee to meet the objectives of retaining key members of senior management and optimizing the use of their time and services to the Company. We do not provide tax reimbursements for any perquisite. Our Chief Executive Officer’s perquisite compensation is the lowest of our Peer Group.
Market and Industry Comparison
OurThe Compensation Committee believes that in order to retain and motivate key management team members, that have a proven long-term track recordwhich is an important part of success,our compensation program philosophy, total compensation must be competitive relative to the market for the services of our named executive officers. The Compensation Committee used data derived from our Peer Group as one of a number of analytical tools and reference points to inform its decisions about overall compensation, compensation elements, optimum pay mix and the relative competitive landscape. The Committee places great value on the exceptional caliber of our named executive officers, as well as the strategic benefits accrued from a stable long-tenured senior management team that has led the Company since its IPO—which is reflected in the Company's outstanding long-term performance, on both an absolute basis as well as relative to our Peer Group, and market indices. Mr. Healey is a widely recognized leader in the asset management industry whose vision and leadership have built AMG over a 20-year period from an early-stage company into one of the largest asset management businesses in the industry, and attracted a world-class group of senior executives in the process. Retention of Mr. Healey and the other senior executive officers in a highly competitive market for executive talent is therefore a key priority.
The Compensation Committee continuously reviews our Peer Group in order to ensure its ongoing relevance. In determining the Company'sCompany’s Peer Group on an annual basis, the Compensation Committee considers both industry and company-specificcompany‑specific dynamics to identify the peers with which we compete for client assets, stockholders and talent. As a result, the Committee focuses on peers within the asset management industry, as well as financial services companies with significant asset management components to their businesses and does not, for example, include retail or investment banks, brokerage or custodian firms, or insurance companies. The Committee also evaluates the Peer Group to ensure that it reflects the Company'sCompany’s growth, overall changes in the asset management industry, and the business models, size and scope of our competitors. The Company has grown significantly in recent years and is now one of the largest publicly-tradedpublicly traded asset management companies globally, as measured by market capitalization. Since 2009, our market capitalization and assets under management have both increased by more than 200%. Given our strategic focus on active equity and alternative products, along with the strong execution of our growth strategy, we are one of the Company is now a top-10five largest global managermanagers of active, return-orientedreturn‑oriented strategies and the fifth largest publicly traded global asset manager, as measured by total assets under management. The addition of the Company to the S&P 500® Index in June 2014 was a direct result of our excellent execution and the resulting growth in the Company's size and our market capitalization.
Similar to prior years, the Compensation Committee reviewed our Peer Group for 20152018 compensation comparisons, applying the following principles as a guide.
Exhibit 11
AMG Guiding Principles for | |||
Consider Industry | Identify companies with a similar business model/philosophy
• Begin with direct ‘pure-play’ peers within the mono-line asset management industry; once mono-line asset manager peers are identified, select those that are most comparable
• Extend search beyond mono-line asset managers to identify peers with operationally similar business models (i.e., financial services companies with a significant asset management component to their business) | ||
Consider Size and Scope | Ensure companies are similar in
• Select large-cap asset managers within the S&P
• Evaluate peers for comparability, primarily considering
• Select asset managers with global scale and international operations | ||
These guiding principles reflect the Compensation Committee'sCommittee’s focus on maintaining a Peer Group that remains relevant throughout the various stages of our growth and expansion, and that reflects current developments in the businesses of our peers. The Committee believes that success in the asset management industry, in particular, relies heavily on human talent, given the service-orientedservice‑oriented and fee-basedfee‑based business model, as well as the modest capital requirements of asset management companies. This is in contrast to other financial services companies, such as banks, insurance, specialty finance, brokerage and custodian firms, and financial information technology companies, which also rely on balance sheet capital, scale of operations and physical infrastructure to drive revenue and profitability. Thus, the size of the businesses competing with us for human talent, as measured by assets or revenues, does not always correspond to their profitability. Further, the Committee recognizes that certain firms within the industries that we compete with for executive talent, such as private equity firms and certain asset managers, use compensation models that are distinct from other businesses when comparing pay as a factor of assets or financial results. As a result, in reviewing the peer universe,Peer Group, the Compensation Committee does not specifically exclude direct competitors based on size alone.
Further, the Compensation Committee recognizesbelieves that, when assessing peer companies, reported total balance sheet assets andwhile some constituents look to revenue are not comparable metrics across the asset management industry, due toas determined under generally accepted accounting considerations for various peer business models as well as our own. In particular, in certain circumstances accounting rules can result in the consolidation of all of the assets of an entity in which the parent company has a control function, even though the parent only holds a small or even nominal economic interest, which can significantly inflate peer company balance sheet assets. Further, our equity method accounting of our minority investments reports our share of the Affiliates' earnings, and means we do not consolidate their results (including their revenue), which may de-emphasize the real economic contributions of these Affiliates. Given these accounting considerations, we believe thatprinciples when comparing peer companies, our GAAP Revenue—which represented 44% of Aggregate fees in 2018—has inherent limitations in providing a full picture of the assetrevenue‑generating power of our business, and that Aggregate fees is the more appropriate measure for peer comparisons. Aggregate fees consists of the total asset‑ and performance‑based fees earned by all of our Affiliates regardless of whether they are consolidated or accounted for under the equity method and is an operating measure used by management business onto evaluate the basisoperating performance and material trends across our entire business. This is in contrast to the companies within our Peer Group, which do not have significant equity method subsidiaries and, therefore, their GAAP Revenue reflects substantially all of total assetstheir asset‑ and revenue is not always meaningful and the results can be difficult to interpret.performance‑based fees.
In addition, the Compensation Committee recognizes that the companies within our Peer Group vary by business strategy (including those with substantial passive investment businesses versus actively actively‑managed investment strategies), product concentration (fixed income/money(money market products versus return‑oriented equity and/or alternative products), overall profitability and stockholder returns. The nature of the roles of
executives also varies by firm. For example, our senior management team has developed a differentiated skill set and reputation to match our unique business model of pursuing long-termlong‑term partnerships with outstanding boutique assetinvestment management firms. Therefore, while the Committee takes Peer Group comparisons into account, it also forms its own perspective on appropriate compensation levels, considering additional subjective factors.
The following Exhibit lists the companies in our Peer Group, which the Compensation Committee reviewed in determining 20152018 compensation for our named executive officers. We believe this Peer Group which is unchanged from the group used for determining 2014 compensation, is consistent with our guiding principles, and includes companies that we compete with for client assets, executive talent and capital providers, including stockholders. This list indicates the other companies in our Peer Group that are also S&P 500®500® companies, which was one of the factors considered by the Compensation Committee in determining our Peer Group. AMG was added toThe following Exhibit also lists the S&P 500® in June 2014 as a resultrevenue of the increased global scale of our business as well as significant growth in our market capitalization, which since 2009 has increased more than 200%, exceeding the growth in market capitalization for all comparatorscompanies in our Peer Group.Group, along with our Aggregate fees for the reasons discussed above. Another factor considered by the Committee, which is commonly referenced in peer group analyses, is the Global Industry Classification Standard or GICS,(“GICS”) code. Within the GICS code applicable to asset management firms (which also includes other businesses in the financial services industry), there are approximately 30 U.S.-basedU.S.‑based asset management companies, from which ourthe Compensation Committee has selected the nine companies that it believes are the most comparable based on the principles previously described.
Exhibit 12
Peer Selection | ||||||||||
Company Name
| FY18 Rev./Fees(1) ($ millions) | AUM(2) ($ billions) | Market Value(3) ($ millions) | S&P 500® Member | ||||||
BlackRock | $ | 14,198 |
| $ | 5,976 |
| $ | 62,270 |
| ✓ |
Ameriprise | 12,835 |
| 431 |
| 14,545 |
| ✓ | |||
Franklin Resources | 6,115 |
| 650 |
| 15,194 |
| ✓ | |||
AMG | 5,442 |
| 736 |
| 5,132 |
| ✓ | |||
T. Rowe Price | 5,373 |
| 962 |
| 22,217 |
| ✓ | |||
Invesco | 5,314 |
| 888 |
| 6,886 |
| ✓ | |||
AB | 3,367 |
| 516 |
| 7,266 |
| — | |||
Legg Mason | 2,996 |
| 727 |
| 2,182 |
| — | |||
Lazard | 2,755 |
| 215 |
| 4,790 |
| — | |||
Eaton Vance | 1,688 |
| 445 |
| 4,099 |
| — | |||
Median | $ | 5,343 |
| $ | 689 |
| $ | 7,076 |
|
|
(1) | Revenue is as of December 31, 2018 (and is on an LTM basis for peers that do not report on a calendar year-end basis). For Eaton Vance, revenue is as of the twelve months ended January 31, 2019. For AMG, reflects Aggregate fees as reported in our Form 10-K for the year ended December 31, 2018. Aggregate fees is an operating measure that consists of the total asset- and performance-based fees earned by all of our Affiliates, as further described in our Annual Report in Form 10-K. |
Peer Selection | ||||||||||||||
Company Name | | Market Value ($ millions) | | AUM ($ billions) | S&P 500 Member | |||||||||
BlackRock | $ | 55,670 | $ | 4,645 | ü | |||||||||
Franklin Resources | 23,244 | 764 | ü | |||||||||||
T. Rowe Price | 18,399 | 763 | ü | |||||||||||
Ameriprise | 16,079 | 629 | ü | |||||||||||
Invesco | 12,846 | 776 | ü | |||||||||||
AMG | | 9,062 | | 628 | ü | |||||||||
AB (formerly AllianceBernstein) | 6,505 | 468 | - | |||||||||||
Eaton Vance | 3,860 | 308 | - | |||||||||||
Legg Mason | 3,735 | 672 | ü | |||||||||||
Waddell & Reed | 1,950 | 104 | - | |||||||||||
Median | | 10,954 | | 650 | ||||||||||
(2) | AUM is as of December 31, 2018. For Eaton Vance, AUM is as of January 31, 2019. For Ameriprise, excludes wealth management, corporate and other AUM. |
(3) | Market value represents diluted market capitalization per FactSet as of December 31, 2018; AB market value is derived by using market value per FactSet and adjusting for ownership structure. |
Note: Market value represents diluted market capitalization per FactSet as of March 31, 2016; AB market value is derived by using market value per FactSet and adjusting for ownership structure. AUM as of December 31, 2015; AMG AUM is pro forma for investments which have since closed.
Compensation Governance Practices
Our Board of Directors is committed to maintaining responsible compensation practices, and believes that rewards for our senior leaders should be commensurate with the results they achieve for our
stockholders. Our strong governance procedures and practices with respect to employment and compensation include the following:
An annual Say‑on‑Pay vote
• | No employment agreements with our Executive Chairman, our Chief Executive Officer, our President, Chief Financial Officer and Treasurer, or our General Counsel |
No employment agreements with the Chairman and Chief Executive Officer, President and Chief Operating Officer, Chief Financial Officer and Treasurer, or General Counsel
The substantial majority of overall executive compensation is in the form of variable performance-basedperformance‑based incentive awards, with base salary and other fixed compensation generally expected to form only a small portion of total compensation
Total Performance-BasedPerformance‑Based Incentive Compensation of each named executive officer, including our Chairman and Chief Executive Officer, is subject to an annual maximum payout equal to the lesser of a fixed dollar amount or a percentage of the Incentive Pool,
The significant majority of total annual compensation is in the form of variable performance-basedequity incentive awards are performance awards with delivery tied to the achievement of pre‑established performance targets
Modest perquisites and is determined based on an assessment of Company performance on both a relative and absolute basis
An insider trading policy that prohibits hedging of Company securities
No pledging of Company securities by directors or officers
No option re-pricingre‑pricing or buy-outsbuy‑outs of underwater stock options
No payment of dividends on equity awards before vesting—accrued dividends are only delivered following vesting and satisfaction of any performance conditions
Equity ownership guidelines for our named executive officers and directors requiring long-termlong‑term ownership of equity totaling a multiple of base salary or directors'directors’ fees
A thorough risk assessment process, as described under "Risk“Risk Considerations in our Compensation Program"Program” below
Double‑trigger vesting upon change in control for all grants awarded after January 1, 2013
Mitigation of the potential dilutive impact of equity awards through share repurchases
A clawback policy that allows, under certain circumstances, for the recoupment of performance-basedperformance‑based compensation from executive officers
Our Compensation Committee
The Compensation Committee oversees our general compensation policies, establishes and reviews the compensation plans and benefit programs applicable to our named executive officers, and administers our stock option and equity incentive plans.
The Compensation Committee currently consists of Messrs. Byrne, Ryan and Zeitlin, with Mr. Zeitlin serving as the Chair. The members of the Committee have significant experience in compensation matters from their service as directors, executive officers and/or advisors to various public and private companies, and the Committee members collectively have extensive experience with the Company and its compensation matters. The Committee'sCommittee’s agenda and meeting calendar are determined by the Committee, with input as appropriate from our Executive Chairman, Mr. Healey, as well as our Chief Executive Officer, Mr. Dalton, who attendsattend meetings at the request of the Committee. In his capacity as Chairman and Chief Executive Officer, Mr. Healey participatesCommittee to participate in discussions with the Committee concerning the compensation of other members of executive management and the design of long-term and equityour incentive plans, but doesdo not participate in discussions regarding histheir own performance goals, contributions or compensation, which occur in executive sessions of the Committee and in meetings of the Committee with our independent compensation consultant.Compensation Consultant. The Committee also invites Mr. Billings, General Counsel and Secretary, to attend certain meetings to discuss the design, implementation and administration of long-termour incentive equity incentive and compensation plans. The Committee has the
sole authority to approve the compensation of our named executive officers and the performance goals related to such plans and programs.
The Compensation Committee regularly meets without management team members present. The Chair from time to time requests that all other independentnon‑executive directors meet with the Committee in executive sessions and otherwise regularly provides reports to the Board of Directors on compensation considerations. The Committee's independent compensation consultantOur Compensation Consultant participates in conference calls and meetings without management present at key points throughout the year, including meetings with the Chair of the Committee.
In 2015,2018, the Compensation Committee again engaged an independent outside executive compensation consulting firm, Thomas E. Shea & Associates, LLC, to assist the Committee with compensation matters, including providing Peer Group benchmarking information and an independent analysis of how our executive and director compensation policies and practices compared to the companies in our Peer Group. In addition to a review of cash and equity compensation and perquisite arrangements across the industry, the analysis provided by Shea & Associatesour Compensation Consultant also considered financial metrics for our Peer Group, including market capitalization, assets under management, various measures of profitability, and stock price performance. In order to prepare its analysis for the Committee, Shea & Associates met from time to time throughout the yearour Compensation Consultant consulted with our management team.team throughout the year.
Shea & Associates,Our Compensation Consultant, which provides no other services to us, reported its findings directly to the Compensation Committee. A representative of Shea & Associatesour Compensation Consultant met with the Committee in formal Committee meetings, as well as outside Committee meetings in sessions with Committee members particularly with the Committee Chair, at key points throughout the year to update the Committee on the status of compensation surveys and make recommendations regarding executive officer and director compensation program and levels.
The independence of Shea & Associatesour Compensation Consultant has been evaluated in accordance with SEC rules, and it has been determined that its work does not raise any conflict of interest.
Severance and Potential Change in Control Compensation and Benefits
We generally do not have employment or individual change in control agreements with any of our named executive officers or our directors, and possible changes in control are addressed through the acceleration of vesting of equity in specific circumstances.
Upon a change in control, outstanding equity awards vesting pursuant to our incentive plans would be accelerated for our named executive officers, as well as for our employees. In order for awards issued after January 1, 2013 to accelerate upon a change in control,employees, provided there mustwas also be a termination of employment without cause or for good reason (i.e., a "double-trigger"“double‑trigger”).
In the event of a change in control (assuming that where applicable, the double-triggerdouble‑trigger has been met), as of December 31, 2015,2018 year‑end, awards held by our named executive officers would have accelerated as set forth below. The market value amounts in the table have been calculated using a share price of $159.76,$97.44, which was the closing price of our common stock on December 31, 2015.as of the last business day of 2018. No amount would have been payable as
of December 31, 20152018 year‑end with respect to the 2013 Long-TermLong‑Term Performance Equity Awards, the 2015 Long‑Term Growth Achievement Awards, the 2016 Long‑Term Growth Achievement Awards or the 2017 Long‑Term Performance Achievement Awards because such awards would continue to beremained subject to multiple performance-basedperformance‑based vesting conditions.conditions as of such date.
Named Executive Officer | Accelerated Distribution under (# Shares)/Market Value | |||
|---|---|---|---|---|
Sean M. Healey | 101,446/$ | |||
Nathaniel Dalton | 60,568/$ | |||
Jay C. Horgen | 54,927/$ | |||
| 7,087/$ | |||
David M. Billings | 6,738/$ |
In July 2011, Mr. Dyson joined asWe do not have employment agreements with any of our named executive officers, with the exception of Hugh P. B. Cutler, our U.K.‑based Head of Global DistributionDistribution. In March 2017, Mr. Cutler joined the Company and entered into an employment agreement with our wholly-ownedwholly owned subsidiary, Affiliated Managers Group Limited (FSA Reference Number 506689).Limited. In 2015,2018, Mr. DysonCutler received an annual base salary of £264,000 ($403,550 U.S.,$400,000 (£296,240 using the average daily exchangeclosing spot rate from January 1, 2015 through December 31, 2015 of 1.5286 GBP/US$)on the date compensation was determined).
Each named executive officer is prohibitedsubject to restrictive covenants that prohibit them from competing with the Company or working for a competing business, and from soliciting certain of our employees, for up to two years following such officer'sofficer’s separation from the Company. Furthermore, each named executive officer is prohibited,subject to restrictive covenants that prohibit them, for one year following such officer'sofficer’s separation from the Company, from soliciting persons or entities that were clients at the time of or in the two years immediately prior to his separation, or that were prospective clients in the year immediately prior to theirhis separation.
Risk Considerations in our Compensation Program
The Compensation Committee has discussed the concept of risk as it relates to our compensation program with our management team and with Shea & Associates.our Compensation Consultant. The Compensation Committee does not believe the goals or the underlying philosophy of our compensation program encourage excessive or inappropriate risk-taking,risk‑taking, or create risks that are reasonably likely to have a material adverse effect on the Company.
Throughout our compensation program, compensation is aligned with increases in stockholder value and long-termlong‑term stockholder interests and, therefore, we believe our compensation arrangements do not encourage inappropriate risk-taking.risk‑taking. The named executive officers'officers’ salaries are fixed in amount and typically account for approximately 10% or less than 10% of their total compensation and less than 5% for our Chairman and Chief Executive Officer.compensation. For 2015,2018, all other compensation (other than base salaries and perquisites) for named executive officers was determined using a performance-basedperformance‑based incentive pool structure linked to specific financial performance metrics, and the total Performance-BasedPerformance‑Based Incentive Compensation of each named executive officer including our Chairman and Chief Executive Officer, was subject to a maximum payout, which for our Chief Executive Officer was equal to the lesser of $25$17.5 million or 40% of the Incentive Pool. Further,Our Chief Executive Officer’s cash bonus was subject to an additional cap of $4.0 million, and his equity incentive awards were further capped at $13.5 million. The Compensation Committee also applied annual caps on Performance‑Based Incentive Compensation for our Executive Chairman and for our President and Chief Financial Officer at the lesser of $10.0 million or 20% of the Incentive Pool, and applied annual caps for our Head of Global Distribution and for our General Counsel at the lesser of $5.0 million or 10% of the Incentive Pool. Additionally, a substantial portion of executive compensation is in the form of long-term equity incentive awards, a meaningful portionmajority of which isare subject to specific pre-establishedpre‑established performance targets, which further aligns executives'executives’ interests with those of our stockholders. TheseWe believe that these awards do not encourage excessive or inappropriate risk-takingrisk‑taking given that the value of the awards is tied to our performance, and the awards are subject to long-termlong‑term vesting schedules to help ensure that executives have significant value tied to long-termlong‑term performance. The Compensation Committee retains discretion in the final amount of awards of Performance‑Based Incentive Compensation, to ensure that the amounts and mix are appropriate. In addition, to further ensure the alignment of compensation with long-termlong‑term performance, we have adopted a clawback policy that allows for the recoupment of performance-basedperformance‑based compensation from executive officers in the event of a material restatement of our financial results due to a material error within three years of the original reporting. In the event of such occurrence, the Board of Directors will review the facts and circumstances that led to the restatement and will take such actions as it deems necessary and appropriate (such as the possible recoupment of incentive compensation of an executive officer).
Pay Ratio
The total annual compensation of our Chief Executive Officer for 2018, as reported in the “Total” column of the Summary Compensation Table, was $7,538,535. The total annual compensation of our median employee for 2018, calculated on the same basis, was $146,010. The ratio of our Chief Executive Officer’s total annual compensation for 2018 to our median employee’s total annual compensation for 2018 was 52 to 1.
We selected our median employee by analyzing the compensation of each of our employees who were employed by the Company as of December 31, 2018, excluding our Chief Executive Officer, with each employee’s compensation calculated by reference to their fixed cash compensation for the year ended December 31, 2018, derived from payroll and other company records. We established a new median employee for 2018, following the CEO transition that occurred during the year. We did not make any cost‑of‑living or other adjustments to these amounts, and did not exclude non‑U.S. employees. We annualized total compensation for full‑time employees that joined the company during 2018 or had an unpaid leave‑of‑absence during the year. For purposes of this analysis, we included all full‑ and part‑time employees at the Company and at our subsidiaries where we control the compensation determinations for the subsidiary’s employees.
We believe executive pay must be internally consistent and equitable to motivate our employees to create stockholder value. We are committed to internal pay equity, and the Compensation Committee monitors the relationship between the pay our executive officers receive and the pay our other employees receive.
Equity Ownership Guidelines
We believe that equity ownership guidelines further align the interests of our named executive officers and directors with those of our stockholders. The enhancedOur equity ownership guidelines provide that an executive officer or director should own equity in the amount of: ten times annual base salary (inin the case of our ChairmanChief Executive Officer and our President and Chief Executive Officer);Financial Officer; seven times annual base salary (inin the case of the other named executive officers); orofficers; and five times base annual fees for service (inin the case of directors). Thesedirectors. Shares underlying outstanding stock options and unearned performance awards are not counted for purposes of
meeting these guidelines. Executives and directors are strongly encouraged to meet these ownership guidelines are to be met within five years from the later of the applicable implementation of the guidelines or becoming an executive officer or director of the Company. All named executive officers and directors currently satisfy these equity ownership guidelines.guidelines, and our Chief Executive Officer and our President and Chief Financial Officer each holds shares of AMG stock at levels that exceed 25x their respective salaries—significantly exceeding the required levels.
Equity Grant Policy
We grant all equity awards, including stock options, under the terms of an equity grant policy. Generally,Pursuant to the policy, we generally grant equity awards to our named executive officers at regularly scheduled meetings of the Compensation Committee in January or February, and to directors at regularly scheduled meetings of the Compensation Committee in January or February and in July or August.August, although the Committee retains discretion to grant awards at other times during the year. If the date of a committee meeting at whichCommittee approval of an equity awards are approvedgrant falls within a regularly scheduled quarterly blackout period under our insider trading policy, the awards will not become effective and are not priced until the closing of the last day of the blackout period following the public release of our earnings results for the prior quarter and/or year, as applicable. In all other cases, the effective grant date of any equity awards will be the date of the relevant committeeCommittee meeting or written consent.
We do not have any program, plan or practice to time equity awards to employees or directors in coordination with the release of material non-publicnon‑public information. If the Compensation Committee is in possession of material non-publicnon‑public information, either favorable or unfavorable, when equity awards are made, the Compensation Committee will not take this information into consideration when determining award amounts.
Tax Deductibility of Compensation
Section 162(m)The availability of the Internal Revenue Code of 1986, as amended from time to time ("Section 162(m)"), generally disallows a tax deductiondeductions for compensation in excess of $1 million paid to any "covered employee" of a publicly held corporation (generally the corporation's chief executive officercash and its next three most highly compensated executive officers, excluding the chief financial officer, in the year that theequity compensation is paid) unless such compensation qualifies as performance-based compensation. The Executive Incentive Plan and the 2013 Stock Incentive Stock Award Plan (the "2013 Stock Plan") were both designed to permit performance-based compensation to be paid to such covered employees. In implementing our compensation program for the 2015 fiscal year, we considered, among other things, the Executive Incentive Plan and the 2013 Stock Plan and the opportunities they afford to provide awards that are intended to meet the performance-based compensation exception under Section 162(m), as described above.
The Compensation Committee considers the availability of a tax deduction as one of many factors consideredthat the Compensation Committee considers in designing a compensation program that is intended to attract and retain executive talent and to reward our named executive officers for their contributions to the success of the Company, whichCompany.
The Internal Revenue Code of 1986, as amended from time to time, under Section 162(m), generally disallows a tax deduction for compensation in excess of $1 million paid to any “covered employee” of a publicly held corporation (generally the corporation’s chief executive officer, chief financial officer, and its next three most highly compensated executive officers, in the year that the compensation is paid). Prior to the enactment of changes in U.S. tax laws in December 2017, compensation paid to any covered employee in excess of $1 million could qualify for an exception to this limitation on deductibility if the compensation qualified as performance‑based compensation. The enactment of changes in U.S. tax laws in December 2017 eliminated this exception for performance‑based compensation, but permitted continued deductibility in future years for certain arrangements and awards in place as of November 2, 2017.
In implementing our compensation program for the 2018 fiscal year, the Compensation Committee believes is necessary for our success. As such,considered, among other things, the Committeeability to grant awards that may achieve a tax deduction, and the ability to grant awards that do not qualify for an exemption from the deduction limitations under Section 162(m)deductibility or that may otherwise beare limited as to tax deductibility.
Separately from determining the Incentive Pool used to determine Performance-Based Incentive Compensation discussed above, the The Compensation Committee establishes the method for calculatingis committed to maintaining a Section 162(m) compliant aggregate cap for annual incentive awardscompensation program and establishing compensation levels that take tax consequences into account, and will continue to each of our namedconsider these issues, while prioritizing a focus on attracting and retaining executive officers pursuant to the relevant incentive plans. The aggregate cap, as well as each named executive officer's maximum allocable portion of the overall aggregate cap, is calculated each year in accordance
talent and aligning management incentives with the requirements of Section 162(m). Neither of these caps, however, serves as the basis for the Compensation Committee's compensation decisions for our named executive officers; instead, these caps serve to establish a ceiling on the amount of annual incentive awards, which the Committee can award to the named executive officers on a tax-deductible basis.long‑term stockholder interests.
Compensation Committee Report
The Compensation Committee has reviewed and discussed this Compensation Discussion and Analysis with our management team. Based on its review and discussions with management, the Compensation Committee recommended to the Board of Directors that this Compensation Discussion and Analysis be included in this Proxy Statement.
JIDE J. ZEITLIN,ChairChair
SAMUEL T. BYRNE
PATRICK T. RYAN
The following tables provide information regarding the compensation arrangements for the years indicated with respect to the Company'sCompany’s Chief Executive Officer, President and Chief Financial Officer, and three other most highly compensated executive officers during the fiscal year ended December 31, 20152018 (collectively, the "named“named executive officers"officers”).
Equity awards granted in February 20162019 in recognition of performance during fiscal year 20152018 do not appear in the following Summary Compensation Table or the Grants of Plan-BasedPlan‑Based Awards table because SEC rules governing the reporting of compensation in those tables require equity awards to be reported in these tables in the fiscal year of grant, even where the awards are intended to compensate executives for performance in a prior year. We have created a supplemental table that reports equity awards in the year in which they arewere earned, to better demonstrate how we evaluate and compensate our named executive officers. For information on the equity awards granted in February 20162019 in recognition of 20152018 performance, please refer to the Supplemental Table—Compensation Earned in Fiscal 2015Year 2018 below, and the related discussion in the Compensation Discussion and Analysis.
Name and Principal Position | Year | Salary ($) | Non-Equity Incentive Plan Compensation ($)(1) | Stock Awards ($) | All Other Compensation ($)(2) | Total ($) | |||||||||||||
|---|---|---|---|---|---|---|---|---|---|---|---|---|---|---|---|---|---|---|---|
Sean M. Healey | 2015 | 750,000 | 3,850,000 | 12,750,000 | (3) | 156,689 | 17,506,689 | ||||||||||||
Chairman and Chief | 2014 | 750,000 | 4,450,000 | — | 169,597 | 5,369,597 | |||||||||||||
Executive Officer | 2013 | 750,000 | 5,000,000 | 14,200,000 | (4) | 57,855 | 20,007,855 | ||||||||||||
Nathaniel Dalton | 2015 | 500,000 | 2,300,000 | 7,600,000 | (3) | 49,631 | 10,449,631 | ||||||||||||
President and Chief | 2014 | 500,000 | 2,650,000 | — | 60,170 | 3,210,170 | |||||||||||||
Operating Officer | 2013 | 500,000 | 3,000,000 | 8,450,000 | (4) | 59,287 | 12,009,287 | ||||||||||||
Jay C. Horgen | 2015 | 500,000 | 1,950,000 | 5,750,000 | (3) | 62,356 | 8,262,356 | ||||||||||||
Chief Financial | 2014 | 500,000 | 2,250,000 | — | 74,604 | 2,824,604 | |||||||||||||
Officer and Treasurer | 2013 | 500,000 | 2,500,000 | 6,850,000 | (4) | 51,704 | 9,901,704 | ||||||||||||
Andrew Dyson(5) | 2015 | 403,550 | 1,538,230 | 2,750,000 | (3) | 39,346 | 4,731,126 | ||||||||||||
Head of Global | 2014 | 406,957 | 1,793,413 | — | 39,767 | 2,240,137 | |||||||||||||
Distribution | 2013 | 334,889 | 1,740,169 | 2,900,000 | (4) | 34,786 | 5,009,844 | ||||||||||||
David M. Billings | 2015 | 400,000 | 1,400,000 | 500,000 | (3) | 31,294 | 2,331,294 | ||||||||||||
General Counsel and | 2014 | 201,538 | 1,271,000 | 500,000 | (7) | 22,551 | 1,995,089 | ||||||||||||
Name and Principal Position |
| Year |
| Salary ($) |
|
| Non-Equity Incentive Plan Compensation ($)(1) |
| Stock Awards ($) |
| Stock Option Awards($) |
| All Other Compensation ($)(2) |
| Total ($) |
| ||||||
Sean M. Healey(3) |
| 2018 |
| 750,000 |
|
|
|
| 2,975,000 |
|
| 8,100,000 | (4) | — |
|
| 263,279 |
|
|
| 12,088,279 |
|
Executive Chairman |
| 2017 |
| 750,000 |
|
|
|
| 3,600,000 |
|
| 9,335,000 | (5) | — |
|
| 115,091 |
|
|
| 13,800,091 |
|
|
| 2016 |
| 750,000 |
|
|
|
| 3,700,000 |
|
| 6,575,000 | (6) | 3,575,000 | (7) |
| 132,572 |
|
|
| 14,732,572 |
|
Nathaniel Dalton(3) |
| 2018 |
| 650,641 |
|
|
|
| 2,000,000 |
|
| 4,850,000 | (4) | — |
|
| 37,894 |
|
|
| 7,538,535 |
|
Chief Executive Officer |
| 2017 |
| 500,000 |
|
|
|
| 2,135,000 |
|
| 5,565,000 | (5) | — |
|
| 31,554 |
|
|
| 8,231,554 |
|
|
| 2016 |
| 500,000 |
|
|
|
| 2,210,000 |
|
| 3,950,000 | (6) | 2,100,000 | (7) |
| 31,054 |
|
|
| 8,791,054 |
|
Jay C. Horgen |
| 2018 |
| 500,000 |
|
|
|
| 1,650,000 |
|
| 3,625,000 | (4) | — |
|
| 45,685 |
|
|
| 5,820,685 |
|
President, Chief Financial |
| 2017 |
| 500,000 |
|
|
|
| 1,850,000 |
|
| 4,200,000 | (5) | — |
|
| 45,045 |
|
|
| 6,595,045 |
|
Officer and Treasurer |
| 2016 |
| 500,000 |
|
|
|
| 1,900,000 |
|
| 2,940,000 | (6) | 1,600,000 | (7) |
| 41,845 |
|
|
| 6,981,845 |
|
Hugh P. B. Cutler |
| 2018 |
| 400,000 |
|
|
|
| 800,000 |
|
| 1,350,000 | (4) | — |
|
| 34,979 |
|
|
| 2,584,979 |
|
Executive Vice President and |
| 2017 |
| 270,833 |
|
|
|
| 1,175,000 |
|
| 1,250,000 | (8) | — |
|
| 26,252 |
|
|
| 2,722,085 |
|
Head of Global Distribution(8) |
|
|
|
|
|
|
|
|
|
|
|
|
|
|
|
|
|
|
|
|
|
|
David M. Billings |
| 2018 |
| 400,000 |
|
|
|
| 1,100,000 |
|
| 595,000 | (4) | — |
|
| 33,554 |
|
|
| 2,128,554 |
|
General Counsel and Secretary |
| 2017 |
| 400,000 |
|
|
|
| 1,265,000 |
|
| 800,000 | (5) | — |
|
| 33,114 |
|
|
| 2,498,114 |
|
|
| 2016 |
| 400,000 |
|
|
|
| 1,300,000 |
|
| 585,000 | (6) | 315,000 | (7) |
| 31,054 |
|
|
| 2,631,054 |
|
Supplemental Table—Compensation Earned in Fiscal 2015
Year 2018
Name |
| Salary ($) |
|
| Cash Bonus ($)(1) |
|
| Long-Term Deferred Equity Awards ($)(9) |
|
| Long-Term Performance Achievement Awards ($)(10) |
|
| All Other Compensation ($)(2) |
|
| Total Compensation Earned ($) |
| ||||||
Nathaniel Dalton(3) |
|
| 650,641 |
|
|
| 2,000,000 |
|
|
| 1,800,000 |
|
|
| 2,700,000 |
|
|
| 37,894 |
|
|
| 7,188,535 |
|
Sean M. Healey(3) |
| 750,000 |
|
|
| 2,975,000 |
|
|
| 1,905,000 |
|
|
| 1,270,000 |
|
|
| 263,279 |
|
| 7,163,279 |
| ||
Jay C. Horgen |
|
| 500,000 |
|
|
| 1,650,000 |
|
|
| 1,400,000 |
|
|
| 2,100,000 |
|
|
| 45,685 |
|
|
| 5,695,685 |
|
Hugh P. B. Cutler |
|
| 400,000 |
|
|
| 800,000 |
|
|
| 480,000 |
|
|
| 720,000 |
|
|
| 34,979 |
|
|
| 2,434,979 |
|
David M. Billings |
|
| 400,000 |
|
|
| 1,100,000 |
|
|
| 240,000 |
|
|
| 360,000 |
|
|
| 33,554 |
|
|
| 2,133,554 |
|
Name | Salary ($) | Non-Equity Incentive Plan Compensation ($)(1) | Stock Awards ($)(8) | Stock Option Awards ($)(9) | All Other Compensation ($)(2) | Total 2015 Compensation Earned ($) | Total 2014 Compensation Earned ($) | |||||||||||||||
|---|---|---|---|---|---|---|---|---|---|---|---|---|---|---|---|---|---|---|---|---|---|---|
Sean M. Healey | 750,000 | 3,850,000 | 6,575,000 | 3,575,000 | 156,689 | 14,906,689 | 18,119,597 | |||||||||||||||
Nathaniel Dalton | 500,000 | 2,300,000 | 3,950,000 | 2,100,000 | 49,631 | 8,899,631 | 10,810,170 | |||||||||||||||
Jay C. Horgen | 500,000 | 1,950,000 | 2,940,000 | 1,600,000 | 62,356 | 7,052,356 | 8,574,604 | |||||||||||||||
Andrew Dyson(5) | 403,550 | 1,538,230 | 1,445,000 | 780,000 | 39,346 | 4,206,126 | 4,990,137 | |||||||||||||||
David M. Billings(6) | 400,000 | 1,400,000 | 585,000 | 315,000 | 31,294 | 2,731,294 | 2,495,089 | |||||||||||||||
(1) | For 2018, these amounts represent performance‑based cash bonus awards determined by the Compensation Committee using the Incentive Pool, established by the Compensation Committee as a set percentage of Adjusted Economic net income, the Short‑Term Incentive Compensation Performance Assessment, and other factors as described in the Compensation Discussion and Analysis. |
(3) | Mr. Healey became Executive Chairman of the Company as of May 25, 2018, and Mr. Dalton became Chief Executive Officer, and his salary was increased to $750,000, as of such date. Mr. Healey previously served as the Company’s Chairman and Chief Executive Officer, and Mr. Dalton previously served as President and Chief Operating Officer. |
(4) | Represents the aggregate grant date fair value (computed in accordance with FASB ASC Topic 718) of the following equity incentive awards consisting of restricted stock units granted under the 2013 Stock Incentive Award Plan (the “2013 Stock Plan”) in January 2018 in recognition of performance in 2017: (i) 2017 Long‑Term Deferred Equity Awards granted to Messrs. Healey, Dalton, Horgen, Cutler and Billings with grant date fair values of $3,200,000, $1,925,000, $1,450,000, $540,000 and $240,000, respectively, and (ii) 2017 Long‑Term Performance Achievement Awards granted to Messrs. Healey, Dalton, Horgen, Cutler and Billings with grant date fair values of $4,900,000, $2,925,000, $2,175,000, $810,000 and $355,000, respectively. The portions of the 2017 Long‑Term Performance Achievement Awards that will be eligible to vest will be based on the Company’s level of achievement measured against pre‑established performance targets measuring Average Return on Equity, defined as the annual average of the Company’s Economic net income (calculated on a pre‑compensation basis) over a three‑year measurement period ending on December 31, 2020, divided by the quarterly average of the Company’s Total stockholder’s equity, controlling interest (excluding accumulated other comprehensive income) over such period, reflected as a percentage. If Average Return on Equity is below 14% for the measurement period, no shares underlying the initial award will be issued and distributed. If Average Return on Equity is between 14% and 22% for the measurement period, a ratable portion between 20% and up to a maximum of 180% of the shares underlying the initial award will be issued and distributed, with 100% of the shares underlying the initial award issued and distributed if a mid‑point of 18% Average Return on Equity is achieved. The grant date fair value of the 2017 Long‑Term Performance Achievement Awards assumes that the mid‑point level of Average Return on Equity is achieved. For details on the assumptions made in the valuation of these and other awards described herein, see the Company’s 2018 Annual Report on Form 10‑K, under “Critical Accounting Estimates and Judgments—Share‑Based Compensation and Affiliate Equity” and the “Share‑Based Compensation” note to the Consolidated Financial Statements included therein. |
(5) | Represents the aggregate grant date fair value (computed in accordance with FASB ASC Topic 718) of the following equity incentive awards consisting of restricted stock units granted under the 2013 Stock Plan in January 2017 in recognition of performance in 2016: (i) 2016 Long‑Term Deferred Equity Awards granted to Messrs. Healey, Dalton, Horgen and Billings with grant date fair values of $6,060,000, $3,615,000, $2,700,000 and $515,000, respectively, and (ii) 2016 Long‑Term Growth Achievement Awards granted to Messrs. Healey, Dalton, Horgen and Billings with grant date fair values (assuming the highest level of performance will be achieved) of $3,275,000, $1,950,000, $1,500,000 and $285,000, respectively. The portions of the 2016 Long‑Term Growth Achievement Awards that will be eligible to vest will be based on growth rates of the Company’s Economic earnings per share, as compared to a base amount of $11.85 per share, over three‑, four‑ and five‑year measurement periods ending on December 31, 2019, 2020 and 2021, respectively, measured against primary and secondary performance targets, provided that such targets increase by 2.5% for each subsequent measurement period if no performance targets are met in the prior measurement period. If neither the primary nor the secondary performance target is achieved in a given measurement period, but the growth rate of the Company’s Adjusted Economic earnings per share for the applicable measurement period meets or exceeds the median of the growth rate of earnings per share of the Company’s Peer Group for such period, 50% of the total shares underlying the initial award will be issued and distributed, up to a maximum of 100% of the number of shares underlying the initial award. |
(6) | Represents the aggregate grant date fair value (computed in accordance with FASB ASC Topic 718) of the 2015 Long‑Term Deferred Equity Awards consisting of restricted stock units granted under the 2013 Stock Plan in February 2016 in recognition of performance in 2015. |
(7) | Represents the aggregate grant date fair value (computed in accordance with FASB ASC Topic 718 and assuming the highest level of performance will be achieved) of the 2015 Long‑Term Growth Achievement Awards consisting of stock options granted under the 2011 Stock Option and Incentive Plan (the “2011 Plan”) in February 2016 in recognition of performance in 2015. The number of shares of common stock of the Company underlying each stock option award that may become exercisable is based on growth rates of the Company’s Economic earnings per share, as compared to a base amount of $11.45 per share, over three‑, four‑ and five‑year measurement periods ending on December 31, 2018, 2019 and 2020, respectively, measured against primary and secondary performance targets. |
(9) | Represents the aggregate grant date fair value (computed in accordance with FASB ASC Topic 718) of the 2018 Long‑Term Deferred Equity Awards consisting of restricted stock units granted under the 2013 Stock Plan in February 2019 in recognition of performance in 2018. These awards will vest in four equal installments on January 1, 2020, 2021, 2022 and 2023, in accordance with the same conditions as the 2017 Long‑Term Deferred Equity Awards described in footnote (4) above. |
Grants of Plan-Based Awards in Fiscal Year 2015
2018
| | | Estimated Future Payouts Under Non-Equity Incentive Plan Awards(1) | Estimated Future Payouts Under Equity Incentive Plan Awards | | |||||||||||||||||||||||||||||||||||||||||||||||||||||||||||||||||
|---|---|---|---|---|---|---|---|---|---|---|---|---|---|---|---|---|---|---|---|---|---|---|---|---|---|---|---|---|---|---|---|---|---|---|---|---|---|---|---|---|---|---|---|---|---|---|---|---|---|---|---|---|---|---|---|---|---|---|---|---|---|---|---|---|---|---|---|---|---|
| | | Grant Date Fair Value of Shares ($) |
|
|
| Date of |
| Estimated Future Payouts Under Non-Equity Incentive Plan Awards(1) |
|
| Estimated Future Payouts Under Equity Incentive Plan Awards |
|
| Grant Date Fair Value | |||||||||||||||||||||||||||||||||||||||||||||||||||||||
Name | Grant Date | Threshold ($) | Target ($) | Maximum ($) | Threshold (#) | Target (#) | Maximum (#) |
| Grant Date |
| Committee Action |
|
| Threshold ($) |
|
| Target ($) |
|
| Maximum ($) |
|
| Threshold (#) |
|
| Target (#) |
|
| Maximum (#) |
|
| of Stock Awards ($) |
| ||||||||||||||||||||||||||||||||||||
Sean M. Healey | 1/25/2016 | — | 3,850,000 | — | — | — | — | — |
| 1/28/2019 |
|
|
| — |
|
|
| — |
|
|
| 2,975,000 |
|
|
| — |
|
|
| — |
|
|
| — |
|
|
| — |
|
|
| — |
| ||||||||||||||||||||||||||
| 1/20/2015 | (2) | — | — | — | — | 42,975 | — | 8,500,000 |
| 1/30/2018 | (2) |
| 1/22/2018 |
|
|
| — |
|
|
| — |
|
|
| — |
|
|
| — |
|
|
| 15,746 |
|
|
| — |
|
| 3,200,000 |
| ||||||||||||||||||||||||||||
| 1/20/2015 | (3) | — | — | — | — | 21,487 | — | 4,250,000 |
| 1/30/2018 | (3) |
| 1/22/2018 |
|
|
| — |
|
|
| — |
|
|
| — |
|
|
| — |
|
|
| 24,112 |
|
|
| 43,402 |
|
| 4,900,000 |
| ||||||||||||||||||||||||||||
Nathaniel Dalton | 1/25/2016 | — | 2,300,000 | — | — | — | — | — |
| 1/28/2019 |
|
|
| — |
|
|
| — |
|
|
| 2,000,000 |
|
|
| — |
|
|
| — |
|
|
| — |
|
|
| — |
|
|
| — |
| ||||||||||||||||||||||||||
| 1/20/2015 | (2) | — | — | — | — | 25,785 | — | 5,100,000 |
| 1/30/2018 | (2) |
| 1/22/2018 |
|
|
| — |
|
|
| — |
|
|
| — |
|
|
| — |
|
|
| 9,472 |
|
|
| — |
|
| 1,925,000 |
| ||||||||||||||||||||||||||||
| 1/20/2015 | (3) | — | — | — | — | 12,640 | — | 2,500,000 |
| 1/30/2018 | (3) |
| 1/22/2018 |
|
|
| — |
|
|
| — |
|
|
| — |
|
|
| — |
|
|
| 14,393 |
|
|
| 25,907 |
|
| 2,925,000 |
| ||||||||||||||||||||||||||||
Jay C. Horgen | 1/25/2016 | — | 1,950,000 | — | — | — | — | — |
| 1/28/2019 |
|
|
| — |
|
|
| — |
|
|
| 1,650,000 |
|
|
| — |
|
|
| — |
|
|
| — |
|
|
| — |
|
|
| — |
| ||||||||||||||||||||||||||
| 1/20/2015 | (2) | — | — | — | — | 21,993 | — | 4,350,000 |
| 1/30/2018 | (2) |
| 1/22/2018 |
|
|
| — |
|
|
| — |
|
|
| — |
|
|
| — |
|
|
| 7,135 |
|
|
| — |
|
| 1,450,000 |
| ||||||||||||||||||||||||||||
| 1/20/2015 | (3) | — | — | — | — | 7,078 | — | 1,400,000 |
| 1/30/2018 | (3) |
| 1/22/2018 |
|
|
| — |
|
|
| — |
|
|
| — |
|
|
| — |
|
|
| 10,703 |
|
|
| 19,265 |
|
| 2,175,000 |
| ||||||||||||||||||||||||||||
Andrew Dyson | 1/25/2016 | — | 1,538,230 | — | — | — | — | — | |||||||||||||||||||||||||||||||||||||||||||||||||||||||||||||
Hugh P. B. Cutler |
| 1/28/2019 |
|
|
| — |
|
|
| — |
|
|
| 800,000 |
|
|
| — |
|
|
| — |
|
|
| — |
|
|
| — |
|
|
| — |
| ||||||||||||||||||||||||||||||||||
| 1/20/2015 | (2) | — | — | — | — | 10,617 | — | 2,100,000 |
| 1/30/2018 | (2) |
| 1/22/2018 |
|
|
| — |
|
|
| — |
|
|
| — |
|
|
| — |
|
|
| 2,657 |
|
|
| — |
|
|
| 540,000 |
| |||||||||||||||||||||||||||
| 1/20/2015 | (3) | — | — | — | — | 3,286 | — | 650,000 |
| 1/30/2018 | (3) |
| 1/22/2018 |
|
|
| — |
|
|
| — |
|
|
| — |
|
|
| — |
|
|
| 3,986 |
|
|
| 7,175 |
|
|
| 810,000 |
| |||||||||||||||||||||||||||
David M. Billings | 1/25/2016 | — | 1,400,000 | — | — | — | — | — |
| 1/28/2019 |
|
|
| — |
|
|
| — |
|
|
| 1,100,000 |
|
|
| — |
|
|
| — |
|
|
| — |
|
|
| — |
|
|
| — |
| ||||||||||||||||||||||||||
| 1/20/2015 | (2) | — | — | — | — | 2,528 | — | 500,000 |
| 1/30/2018 | (2) |
| 1/22/2018 |
|
|
| — |
|
|
| — |
|
|
| — |
|
|
| — |
|
|
| 1,181 |
|
|
| — |
|
|
| 240,000 |
| |||||||||||||||||||||||||||
|
| 1/30/2018 | (3) |
| 1/22/2018 |
|
|
| — |
|
|
| — |
|
|
| — |
|
|
| — |
|
|
| 1,747 |
|
|
| 3,145 |
|
|
| 355,000 |
| |||||||||||||||||||||||||||||||||||
(1) | Represents performance‑based cash bonuses awarded to each named executive officer in recognition of performance in 2018. See footnote (1) to the Summary Compensation Table for additional details regarding these awards. |
(2) | Represents 2017 Long‑Term Deferred Equity Awards granted in January 2018 under the 2013 Stock Plan in recognition of performance in 2017, vesting in four equal installments on January 1, 2019, 2020, 2021 and 2022, subject to continued employment through each vesting date (with certain limited exceptions in the case of death, disability or certain terminations of employment in connection with a change in control). The grant date fair value has been computed in accordance with FASB ASC Topic 718. |
(3) | Represents 2017 Long‑Term Performance Achievement Awards granted in January 2018 under the 2013 Stock Plan in recognition of performance in 2017, vesting in full on January 1, 2021, subject to continued employment through the vesting date (with certain limited exceptions in the case of death, disability or certain terminations of employment in connection with a change in control). The number of shares of common stock of the Company underlying each award that may be issued and distributed for each restricted stock unit is based on the Company’s level of achievement measured against pre‑established performance targets measuring the Company’s Average Return on Equity over a three‑year measurement period ending on December 31, 2020. The grant date fair value has been computed in accordance with FASB ASC Topic 718, and assumes that the mid‑point level of Average Return on Equity will be achieved. |
Outstanding Equity Awards at 20152018 Fiscal Year-End
|
| Option Awards |
| Stock Awards | |||||||||||||||||||||||||
Name |
| Number of Securities Underlying Unexercised Options Exercisable (#) |
|
| Number of Securities Underlying Unexercised Unearned Options (#)(1) |
|
| Option Exercise Price ($) |
|
| Option Expiration Date |
| Number of Shares of Stock That Have Not Vested (#)(2) |
|
| Market or Payout Value of Shares of Stock That Have Not Vested ($) |
|
| Equity Incentive Plan Awards: Number of Unearned Shares of Stock That Have Not Vested (#)(3) |
|
| Equity Incentive Plan Awards: Market Value of Unearned Shares of Stock That Have Not Vested ($) | |||||||
Sean M. Healey |
|
| — |
|
| 91,902 |
|
|
| 122.40 |
|
| 2/3/2023 |
|
| 101,446 |
|
|
| 9,884,898 |
|
|
| 94,007 |
|
| 4,446,850 | ||
Nathaniel Dalton |
|
| — |
|
| 53,985 |
|
|
| 122.40 |
|
| 2/3/2023 |
|
| 60,568 |
|
|
| 5,901,746 |
|
|
| 56,439 |
|
| 2,651,343 | ||
Jay C. Horgen |
|
| — |
|
| 41,131) |
|
|
| 122.40 |
|
| 2/3/2023 |
|
| 54,927 |
|
|
| 5,352,087 |
|
|
| 29,535 |
|
| 2,002,736 | ||
Hugh P. B. Cutler |
|
| — |
|
|
| — |
|
|
| — |
|
| — |
|
| 7,087 |
|
|
| 690,557 |
|
|
| 3,986 |
|
| 388,396 | |
David M. Billings |
|
| — |
|
| 8,098 |
|
|
| 122.40 |
|
| 2/3/2023 |
|
| 6,738 |
|
|
| 656,551 |
|
|
| 3,618 |
|
| 352,538 | ||
| | Option Awards | Stock Awards | |||||||||||||||||||||||
|---|---|---|---|---|---|---|---|---|---|---|---|---|---|---|---|---|---|---|---|---|---|---|---|---|---|
Name | Number of Securities Underlying Unexercised Options Exercisable (#) | Number of Securities Underlying Unexercised Options Unexercisable (#) | Option Exercise Price ($) | Option Expiration Date | Number of Shares of Stock That Have Not Vested (#)(1) | Market or Payout Value of Shares of Stock That Have Not Vested ($) | Equity Incentive Plan Awards: Number of Unearned Shares of Stock That Have Not Vested (#)(2) | Equity Incentive Plan Awards: Market Value of Unearned Shares of Stock That Have Not Vested ($) | |||||||||||||||||
Sean M. Healey | 1,611 | (3) | — | 62.04 | 7/21/2016 | 69,162 | 11,049,321 | 87,078 | 6,179,197 | ||||||||||||||||
| 1,589 | (4) | 62.91 | 7/20/2017 | ||||||||||||||||||||||
| 150,000 | (4) | 95.82 | 12/14/2017 | ||||||||||||||||||||||
| 150,000 | (5) | 99.66 | 7/19/2018 | ||||||||||||||||||||||
Nathaniel Dalton | 1,611 | (3) | — | 62.04 | 7/21/2016 | 41,964 | 6,704,169 | 51,962 | 3,628,948 | ||||||||||||||||
| 75,000 | (4) | 62.91 | 7/20/2017 | ||||||||||||||||||||||
| 75,000 | (4) | 95.82 | 12/14/2017 | ||||||||||||||||||||||
| 90,000 | (5) | 99.66 | 7/19/2018 | ||||||||||||||||||||||
Jay C. Horgen | 45,000 | (5) | — | 95.82 | 12/14/2017 | 33,893 | 5,414,746 | 36,360 | 4,373,110 | ||||||||||||||||
| 75,000 | (5) | 99.66 | 7/19/2018 | ||||||||||||||||||||||
Andrew Dyson | 40,000 | (5) | — | 99.66 | 7/19/2018 | 14,710 | 2,350,070 | 16,809 | 1,249,643 | ||||||||||||||||
David M. Billings | — | — | — | — | 3,745 | 598,301 | — | — | |||||||||||||||||
(1) | Represents awards of performance‑based options granted under the 2011 Plan on February 3, 2016 that vested on January 1, 2019, the exercise of which remained subject to the achievement of applicable performance targets at fiscal year‑end. See the Summary Compensation Table for additional details regarding these awards and relevant performance conditions. |
(2) | Represents the following awards of restricted stock units granted under the 2013 Stock Plan: (i) 2017 Long‑Term Deferred Equity Awards granted in January 2018, vesting in four equal installments on January 1, 2019, 2020, 2021 and 2022, (ii) 2016 Long‑Term Deferred Equity Awards granted in January 2017, vesting in four equal installments on December 31, 2017 and January 1, 2019, 2020 and 2021, (iii) 2015 Long‑Term Deferred Equity Awards granted in February 2016, vesting in four equal installments on January 1 and December 31, 2017 and January 1, 2019 and 2020, (iv) 2014 Long‑Term Growth Achievement Awards granted in January 2015, vesting in four equal installments on March 1, 2016, January 1 and December 31, 2017 and January 1, 2019, (v) 2014 Long‑Term Deferred Equity Awards granted in January 2015, vesting in four equal installments on January 1, 2016 and 2017, December 31, 2017 and January 1, 2019, (vi) equity incentive awards granted in December 2013 (a portion of the 2013 Long‑Term Deferred Equity Awards), vesting in four equal installments on December 31, 2017 and January 2, 2019, 2020 and 2021, and (vi) for Mr. Cutler, includes an award granted in March 2017 upon the commencement of his employment with the Company, vesting in four equal installments on December 31, 2017 and January 1, 2019, 2020 and 2021. See the Summary Compensation Table for additional details. For each award set forth above, vesting is subject to continued employment through each vesting date (with certain limited exceptions in the case of death, disability or certain terminations of employment in connection with a change in control). These awards participate in cash dividends declared by the Company, the payment of which is deferred until delivery of the shares and is forfeited if the requisite service period or any performance conditions are not satisfied. |
death, disability or certain terminations of employment in connection with a change in control), with the portion of the 2014 Long-Term Growth Achievement Awards eligible to vest determined based on the Company's level of achievement measured against performance targets measuring the compound annual growth rate of the Company's Economic earnings per share over five- and three-year performance periods ending on December 31, 2015, (ii) the restricted stock unit portion of the 2013 Long-Term Deferred Equity Awards granted in December 2013, which will vest in four equal annual installments on each of January 2, 2018, 2019, 2020 and 2021 (subject to being employed on such date (with certain limited exceptions in the case of death, disability or certain terminations of employment in connection with a change in control)), and (iii) the 2013 Long-Term Performance Equity Awards of restricted stock units divided into three equal tranches, with the number of shares of stock to be issued and distributed for each restricted stock unit granted in each tranche will only become distributable if the Company's stock price reaches performance hurdles of 15%, 25% and 35%, respectively, above the closing price of the Company's common stock on the grant date. The stock price appreciation hurdles for the 2013 Long-Term Performance Equity Awards may be met at any time during the award term, but shares in any tranche will be earned and distributable only on the earliest distribution date (January 2, 2018, 2019 or 2020) upon which each of the following requirements has been satisfied with respect to such tranche: (a) the shares have become time-vested (each tranche vests in four equal annual installments on each of January 2, 2015, 2016, 2017 and 2018 (subject to being employed on such date (and with certain limited exceptions in the case of death, disability or certain terminations of employment in connection with a change in control)), (b) the applicable stock price appreciation hurdle has been met for 30 consecutive trading days and (c) the closing price of the Company's common stock on the applicable distribution date meets the 15% stock price appreciation hurdle. See the Summary Compensation Table for additional details regarding these awards. As of December 31, 2015, the achievement of the performance targets for the 2014 Long-Term Growth Achievement Awards had not yet been determined, and none of the stock price appreciation hurdles for the 2013 Long-Term Performance Equity Awards had been met.
met. These awards participate in cash dividends declared by the Company, the payment of which is deferred until delivery of the shares and is forfeited if the requisite service period or any performance conditions are not satisfied. See the Summary Compensation Table for additional details regarding the 2017 Long‑Term Performance Achievement Awards and the 2016 Long‑Term Growth Achievement Awards and relevant performance conditions. |
Option Exercises and Stock Vested in Fiscal Year 2015
|
| Option Awards |
|
| Stock Awards |
| ||||||||||
Name |
| Number of Shares Acquired on Exercise (#) |
|
| Value Realized on Exercise ($)(1) |
|
| Number of Shares Acquired on Vesting (#) |
|
| Value Realized on Vesting ($) |
| ||||
Sean M. Healey |
|
| 70,031 |
|
|
| 3,588,388 |
|
|
| — |
|
|
| — |
|
Nathaniel Dalton |
|
| — |
|
|
| — |
|
|
| — |
|
|
| — |
|
Jay C. Horgen |
|
| — |
|
|
| — |
|
|
| — |
|
|
| — |
|
Hugh P. B. Cutler |
|
| — |
|
|
| — |
|
|
| — |
|
|
| — |
|
David M. Billings |
|
| — |
|
|
| — |
|
|
| — |
|
|
| — |
|
| | Option Awards | Stock Awards | ||||||||||||||
|---|---|---|---|---|---|---|---|---|---|---|---|---|---|---|---|---|
Name | Number of Shares Acquired on Exercise (#) | Value Realized on Exercise ($)(1) | Number of Shares Acquired on Vesting (#)(2) | Number of Units of Profits Interests Acquired on Vesting (#)(3) | Value Realized on Vesting ($)(4) | |||||||||||
Sean M. Healey | 50,678 | 7,823,518 | 13,093 | 61.16 | 6,699,438 | |||||||||||
Nathaniel Dalton | 145,167 | 22,601,952 | 8,090 | 35.41 | 3,986,786 | |||||||||||
Jay C. Horgen | 16,611 | 2,197,091 | 5,950 | 29.61 | 3,162,105 | |||||||||||
Andrew Dyson | — | — | 2,047 | 7.73 | 929,261 | |||||||||||
David M. Billings | — | — | 609 | — | 133,127 | |||||||||||
(1) | Reflects the aggregate value realized upon the exercise of options in 2018. The exercise price of these options was $99.66, which was equal to the fair market value of a share of the Company’s common stock on the applicable date of grant. |
grant, which the 2010 LTEIP awards did not. For information on the number of units that were granted to each of our named executive officers under these plans, please see the Executive Compensation Tables (Grants of Plan Based Awards in Fiscal Year) included in the Company's proxy statement for the relevant year.
Director Compensation
At the request of the Compensation Committee, Shea & Associatesour Compensation Consultant regularly provides a review of director compensation in the broad peer universe and in our Peer Group. This analysis includes data on total compensation for directors at such peer companies, as well as on the individual components of that compensation, such as annual retainers, meeting fees and equity awards. Shea & AssociatesOur Compensation Consultant also provides comparative data from time to time on compensation by board position (such as committee chairs and lead directors) and information on the nature of the service of particular directors in their various capacities (e.g., lead directors) at such companies. Shea & AssociatesOur Compensation Consultant also provides information from time to time to the Compensation Committee on trends in director compensation.
In determining current compensation levels for the Company'sCompany’s directors, the Compensation Committee'sCommittee’s objective is that cash compensation be set at or near the median in comparison to directors at public companies within our Peer Group, while equity compensation linked to stockholder value be higher on a relative basis. The annual fee for service by non-managementnon‑executive directors is $80,000. Directors do not receive quarterly meeting fees. Committee fees are as follows: members of the Audit Committee receive an annual fee of $20,000, with the Chair receiving an annual fee of $35,000; members of the Compensation Committee receive an annual fee of $17,000, with the Chair receiving an annual fee of $20,000; and members of the Nominating and Governance Committee receive an annual fee of $13,000, with the Chair receiving an annual fee of $15,000. The Chair of each Committee receives the annual Chair fee in lieu of the Committee fee. In addition, the Lead Independent Director receives a fee of $100,000 for his active role as principal liaison with management of the Company and for his services as the principal contact on our Board of Directors for our stockholders and other interested parties. All directors of the Company are provided information technology and support by the Company and are reimbursed for travel expenses incurred in attending meetings of the Board of Directors and its committees, as well as Board-relatedBoard‑related activities.
Equity grant determinations for directors are made consistent with the Compensation Committee'sCommittee’s philosophy that compensation should be directly linked to increases in stockholder value. Directors are granted awards, on a semi-annualsemi‑annual basis in January or February and in July or August, under the Deferred Compensation Plan, in an aggregate amount of $80,000.$80,000, vesting in 25% increments over four years. The directors may determine how these awards are invested, and, to date, they have elected to invest all awards in the stock unit fund under the Deferred Compensation Plan. The number of stock units subject to each award is determined based on the fair market value of the Company'sCompany’s common stock on the grant date, with each stock unit representing one share of the Company'sCompany’s common stock. These awards participate in cash dividends declared by the Company, with such cash dividends invested in the stock unit fund until shares subject to the awards are vested and delivered. Cash dividends are forfeited if the applicable vesting conditions are not satisfied. Directors also receive semi-annualsemi‑annual stock option grants in January or February and in July or August, with an aggregate annual grant date Black-ScholesBlack‑Scholes value of $120,000. Each of these awards is subject to vesting, in 25% increments over four years. This vesting period is longer than the one-threeone‑to‑three year vesting schedules employed by companies in our Peer Group and across the market more generally.
Director Compensation in Fiscal Year 20152018
The following table sets forth information regarding the compensation earned by the Company's non-managementCompany’s non‑executive directors in 2015.2018. For compensation information with respect to Mr.Messrs. Healey and hisDalton and their services as the Company'sExecutive Chairman and Chief Executive Officer of the Company, respectively, please see the Summary Compensation Table and other accompanying compensation tables. Mr.Messrs. Healey receivesand Dalton receive no additional compensation for his servicetheir services as a director. Mr. Earle was appointed to our Board of Directors in April 2015.
Mr. Meyerman served as a director until January 21, 2015, and all outstanding and unvested stock and option awards held by Mr. Meyerman as of such date accelerated pursuant to the terms of the applicable plans or award agreements. In recognition of Mr. Meyerman's nearly 16 years of service as a director, the Compensation Committee determined that Mr. Meyerman's estate would be permitted to exercise all of his outstanding options until the earlier of January 2017 or the applicable expiration date of the stock option. Mr. Nutt retired from the Board of Directors on June 15, 2015, and all outstanding and unvested stock awards held by Mr. Nutt as of such date accelerated pursuant to the terms of the applicable plan. In recognition of Mr. Nutt's 22 years of service, the Compensation Committee approved the accelerated vesting of all outstanding and unvested option awards held by Mr. Nutt as of the date of his retirement and provided that Mr. Nutt would be permitted to exercise all outstanding options then held by him until the earlier of the second anniversary of the date of his retirement and the applicable expiration date of the stock option.
Name |
| Fees Earned or Paid in Cash ($) |
|
| Stock Awards ($)(1) |
|
| Option Awards ($)(2) |
|
| All Other Compensation ($) |
|
| Total ($) |
| |||||
Samuel T. Byrne |
|
| 130,000 |
|
|
| 80,037 |
|
|
| 120,085 |
|
|
| — |
|
|
| 330,122 |
|
Dwight D. Churchill |
|
| 115,000 |
|
|
| 80,037 |
|
|
| 120,085 |
|
|
| — |
|
|
| 315,122 |
|
Glenn Earle |
|
| 100,000 |
|
|
| 80,037 |
|
|
| 120,085 |
|
|
| — |
|
|
| 300,122 |
|
Niall Ferguson |
|
| 93,000 |
|
|
| 80,037 |
|
|
| 120,085 |
|
|
| — |
|
|
| 293,122 |
|
Tracy P. Palandjian |
|
| 113,000 |
|
|
| 80,037 |
|
|
| 120,085 |
|
|
| — |
|
|
| 313,122 |
|
Patrick T. Ryan |
|
| 232,000 |
|
|
| 80,037 |
|
|
| 120,085 |
|
|
| — |
|
|
| 432,122 |
|
Jide J. Zeitlin |
|
| 105,000 |
|
|
| 80,037 |
|
|
| 120,085 |
|
|
| — |
|
|
| 305,122 |
|
Karen L. Yerburgh |
|
| 80,000 |
|
|
| 80,037 |
|
|
| 120,085 |
|
|
| — |
|
|
| 280,122 |
|
Name | Fees Earned or Paid in Cash ($) | Stock Awards ($)(1) | Option Awards ($)(2) | All Other Compensation ($) | Total ($) | |||||||||||
|---|---|---|---|---|---|---|---|---|---|---|---|---|---|---|---|---|
Samuel T. Byrne | 130,000 | 80,047 | 120,077 | — | 330,124 | |||||||||||
Dwight D. Churchill | 115,000 | 80,047 | 120,077 | — | 315,124 | |||||||||||
Glenn Earle | 75,000 | 80,210 | 120,083 | — | 275,293 | |||||||||||
Niall Ferguson | 93,000 | 80,047 | 120,077 | — | 293,124 | |||||||||||
Harold J. Meyerman | 58,000 | 160,480 | 300,996 | — | 519,476 | |||||||||||
William J. Nutt | 40,000 | 214,814 | 626,752 | — | 881,556 | |||||||||||
Tracy P. Palandjian | 113,000 | 80,047 | 120,077 | — | 313,124 | |||||||||||
Patrick T. Ryan | 232,000 | 80,047 | 120,077 | — | 432,124 | |||||||||||
Jide J. Zeitlin | 102,500 | 80,047 | 120,077 | — | 302,624 | |||||||||||
(1) | On January 30, 2018 and July 31, 2018, the Company granted awards to each non‑executive director then serving on our Board of Directors (in each case, vesting 25% on each of January 1, 2019, 2020, 2021 and 2022). The grant date fair value of each award granted on January 30, 2018 and July 31, 2018, computed in accordance with FASB ASC Topic 718, is $40,034 and $40,003, respectively. As of December 31, 2018, the aggregate unvested portion of awards made under the Deferred Compensation Plan (measured in shares of common stock) was as follows: Mr. Byrne: 1,210; Mr. Churchill: 1,210; Mr. Earle: 1,159; Mr. Ferguson: 1,210; Ms. Palandjian: 1,210; Mr. Ryan: 1,210; Ms. Yerburgh: 447; and Mr. Zeitlin: 1,210. |
With respect to Messrs. Meyerman and Nutt, the amounts in the table include the aggregate incremental fair value of each stock option award that was accelerated and for which the exercise date was extended, calculated in accordance with FASB ASC Topic 718, was $240,975 and $556,731, respectively. At December 31, 2015, the number of shares of common stock subject to stock options held by each director was as follows: Mr. Byrne: 15,410; Mr. Churchill: 17,581; Mr. Earle: 523; Mr. Ferguson: 1,574; Ms. Palandjian: 6,778; Mr. Ryan: 34,742; and Mr. Zeitlin: 72,085. See page 37 of the Company's 2015 Annual Report on Form 10-K for a discussion of the assumptions used in calculating the grant date fair value of stock options.
(2) | On January 30, 2018 and July 31, 2018, the Company granted 1,116 and 1,353 stock options, respectively, to each non‑executive director then serving on our Board of Directors (in each case, vesting 25% on each of January 1, 2019, 2020, 2021 and 2022). The grant date fair value of the stock options granted on January 30, 2018 and July 31, 2018, computed in accordance with FASB ASC Topic 718, is $60,052 and $60,033, respectively. As of December 31, 2018, the number of shares of common stock subject to stock options held by each director was as follows: Mr. Byrne: 19,572; Mr. Churchill: 16,161; Mr. Earle: 9,956; Mr. Ferguson: 12,109; Ms. Palandjian: 17,855; Mr. Ryan: 19,572; Ms. Yerburgh: 2,469; and Mr. Zeitlin: 19,572. |
Equity Compensation Plan Information
The following table sets forth information regarding the securities authorized for issuance under our equity compensation plans as of December 31, 2015:2018:
|
| Number of securities to be issued upon exercise of outstanding options, warrants and rights |
| Weighted-average exercise price of outstanding options, warrants and rights |
| Number of securities remaining available for future issuance under compensation plans (excluding securities reflected in column (a)) |
|
| (a) |
| (b) |
| (c) |
Equity compensation plans approved by stockholders(1) |
| 471,017 |
| 132.23 |
| 3,957,649 |
Equity compensation plans not approved by stockholders(2) |
| 10,233 |
| 65.51 |
| 22,208 |
Total |
| 481,250 |
| 130.81 |
| 3,979,857 |
| | Number of securities to be issued upon exercise of outstanding options, warrants and rights | Weighted-average exercise price of outstanding options, warrants and rights | Number of securities remaining available for future issuance under compensation plans (excluding securities reflected in column (a)) | |||||||
|---|---|---|---|---|---|---|---|---|---|---|
| | (a) | (b) | (c) | |||||||
Equity compensation plans approved by stockholders(1) | 1,613,571 | $ | 67.70 | 4,954,820 | ||||||
Equity compensation plans not approved by stockholders(2) | 109,577 | $ | 81.06 | 10,958 | ||||||
Total | 1,723,148 | $ | 68.55 | 4,965,778 | ||||||
(1) | Consists of the 2011 Plan and the 2013 Stock Plan. |
(2) | Consists of the Amended and Restated 2002 Stock Option and Incentive Plan. The 22,208 shares available for issuance under this plan may be issued pursuant to stock option awards, deferred stock awards, restricted stock awards, unrestricted stock awards, restricted stock unit awards, performance share awards or dividend equivalent rights. |
PROPOSAL 2: ADVISORY VOTE ON EXECUTIVE COMPENSATION
In accordance with the requirements of Section 14A of the Securities Exchange Act of 1934, as amended ("Exchange Act"(the “Exchange Act”), we are again providing for a non-binding,non‑binding, advisory vote for stockholders to approve the compensation of our named executive officers, as disclosed in this Proxy Statement, pursuant to Item 402 of Regulation S-K.S‑K. The Board of Directors has determined to hold an advisory vote on our named executive officers’ compensation annually, consistent with the outcome of the advisory vote of our stockholders at our 2017 Annual Meeting of Stockholders.
While this vote is advisory and not binding on the Company, the Board of Directors and the Compensation Committee value the opinionsviews of our stockholders, and will continue to consider, among other factors, the outcome of the vote when making future compensation decisions for our named executive officers.
In considering your vote on the compensation of our named executive officers, please review the Compensation Discussion and Analysis beginning on page 2127 of this Proxy Statement. The Compensation Discussion and Analysis describes the Company'sCompany’s executive compensation program and the decisions that the Compensation Committee made with respect to the compensation of our named executive officers.
Our executive compensation program is designed to enable the Company to attract, motivate and retain key persons while, at the same time, creating a close relationship between performance and compensation. In addition, theThe Company regularly reviews its compensation program and the overall compensation package paid to each of its named executive officers, including through the engagement of an independent compensation consultant, to assess risk and to ensure that the program is structured appropriately in order to achieve the Company'sCompany’s strategic goals.
Approval of the advisory vote on executive compensation requires the affirmative vote of a majority of the shares of the Company's common stock outstanding and entitled to vote, in person or by proxy,cast at the Annual Meeting. Abstentions and broker non-votesnon‑votes will have no effect on this proposal. The Board of Directors has determined to hold an advisory vote on our named executive officers' compensation annually, with the next vote to occur at the 2017 Annual Meeting of Stockholders.
Recommendation of the Board of Directors
The Board of Directors unanimously recommends that the Company'sCompany’s stockholders voteFOR the approval, on an advisory basis, of the compensation paid to our named executive officers, as disclosed in this Proxy Statement, pursuant to Item 402 of Regulation S-K. Although the vote we are asking you to cast is non-binding, the Compensation Committee and the Board of Directors value the views of our stockholders and will consider, among other factors, the outcome of the vote when determining future compensation arrangements for our named executive officers.S‑K.
PROPOSAL 3: RATIFICATION OF THE
SELECTION OF INDEPENDENT REGISTERED PUBLIC ACCOUNTING FIRM
The Audit Committee of the Board of Directors has selected PricewaterhouseCoopers LLPPwC as the Company'sCompany’s independent registered public accounting firm for the current fiscal year, subject to ratification by the Company'sCompany’s stockholders at the Annual Meeting. PricewaterhouseCoopersPwC has acted as the Company'sCompany’s independent registered public accounting firm since the Company'sCompany’s inception. The Company has been advised by PricewaterhouseCoopersPwC that it is a registered public accounting firm with the Public Company Accounting Oversight Board (the "PCAOB"“PCAOB”) and complies with the auditing, quality control and independence standards and rules of the PCAOB and the SEC. A representative of PricewaterhouseCoopersPwC is expected to be present at the Annual Meeting to respond to appropriate questions and to make a statement if he or she so desires.
Although stockholder ratification of the selection of PricewaterhouseCoopersPwC is not required, the Board of Directors is nevertheless submitting the selection of PricewaterhouseCoopersPwC to the stockholders for ratification. Should the selection of PricewaterhouseCoopers not be ratified by the stockholders, the Audit Committee will reconsider the matter. Even in the event the selection of PricewaterhouseCoopersPwC is ratified, the Audit Committee, in its discretion, may direct the appointment of a different independent registered public accounting firm at any time during the year if it determines that such a change is in the best interests of the Company and its stockholders.
Ratification of the selection of PricewaterhouseCoopersPwC as our independent registered public accounting firm for the current fiscal year requires the affirmative vote of a majority of the shares of common stock cast at the Annual Meeting. Abstentions will have no effect on this proposal.
Recommendation of the Board of Directors
The Board of Directors believes that the selection of PricewaterhouseCoopers LLPPwC as the Company'sCompany’s independent registered public accounting firm is in the best interests of the Company and its stockholders and, therefore, unanimously recommends that the Company'sCompany’s stockholders voteFOR this proposal.
The Audit Committee currently consists of Messrs. Byrne, Churchill, Earle, Ryan and Ryan,Zeitlin, and Ms. Palandjian, each an independent director of the Company, with Mr. Churchill serving as the Chair of the Audit Committee.
The Audit Committee'sCommittee’s purpose is to assist the Board of Directors in oversight of the Company'sCompany’s internal controls and financial statements and the audit process. The Board of Directors has determined in its business judgment that all members of the Audit Committee are "independent,"“independent,” as is required by the listing standards of NYSEthe New York Stock Exchange and under SECSecurities and Exchange Commission rules.
Management is responsible for the preparation, presentation and integrity of the Company'sCompany’s financial statements, accounting and financial reporting principles and internal controls and procedures designed to assure compliance with accounting standards and applicable laws and regulations. The independent registered public accounting firm, PricewaterhouseCoopers LLP (“PwC”), is responsible for performing an independent audit of the consolidated financial statements in accordance with the standards of the Public Company Accounting Oversight Board (the "PCAOB"“PCAOB”).
In performing its oversight role, the Audit Committee has reviewed and discussed the audited financial statements with management and the independent registered public accounting firm.PwC. The Audit Committee has also discussed with the independent registered public accounting firmPwC the matters required to be discussed by the Statement on Auditing Standards No. 61, as amended (AICPA, Professional Standards, Vol. 1, AU section 380), as adopted byapplicable standards of the PCAOB, in Rule 3200T.including Auditing Standard No. 1301, “Communications with Audit Committee,” and other applicable laws and regulations. The Audit Committee has received the written disclosures and the letter from the independent registered public accounting firmPwC required by applicable requirements of the PCAOB regarding the independent registered public accounting firm'sPwC’s communications with the Audit Committee concerning independence, and has discussed with the independent registered public accounting firm the independent registered public accounting firm'sPwC its independence.
Based on the reports and discussions described in this report, and subject to the limitations on the role and responsibilities of the Audit Committee referred to below and in its charter, the Audit Committee recommended to the Board of Directors that the audited financial statements be included in the Annual Report on Form 10-K10‑K for the fiscal year ended December 31, 2015.2018.
The Audit Committee'sCommittee’s role is one of oversight, and members of the Audit Committee rely without independent verification on the information provided to them and on the representations made by management and the independent registered public accounting firm.PwC. Accordingly, the Audit Committee'sCommittee’s oversight does not provide an independent basis to determine that management has maintained appropriate accounting and financial reporting principles or appropriate internal controls and procedures designed to assure compliance with accounting standards and applicable laws and regulations. Furthermore, the Audit Committee'sCommittee’s considerations and discussions referred to above do not assure that the audit of the Company'sCompany’s financial statements has been carried out in accordance with the standards of the PCAOB, that the financial statements are presented in accordance with generally accepted accounting principles or that PricewaterhouseCoopersPwC is in fact "independent."“independent.”
The Audit Committee operates pursuant to a charter that was most recently adopted by the Board of Directors in October 20152018 and is available on the Company'sCompany’s website atwww.amg.comwww.amg.com.
DWIGHT D. CHURCHILL,ChairChair
SAMUEL T. BYRNE
GLENN EARLE
TRACY P. PALANDJIAN
PATRICK T. RYAN
JIDE J. ZEITLIN
Principal Accountant Fees and Services
The following table sets forth information regarding the fees for professional services rendered by the Company's independent registered public accounting firm, PricewaterhouseCoopers LLP,PwC in each of the last two fiscal years:
Type of Fee | Year Ended December 31, 2014 | Year Ended December 31, 2015 | |||||
|---|---|---|---|---|---|---|---|
Audit Fees(1) | $ | 6,169,740 | $ | 6,515,798 | |||
Audit-Related Fees(2) | 1,340,915 | 1,079,803 | |||||
Tax Fees(3) | 4,891,954 | 3,980,148 | |||||
All Other Fees | — | — | |||||
Type of Fee |
| Year Ended December 31, 2017 |
|
| Year Ended December 31, 2018 |
| ||
Audit Fees(1) |
|
| $6,698,238 |
|
|
| $6,766,557 |
|
Audit‑Related Fees(2) |
|
| 1,152,687 |
|
|
| 1,175,556 |
|
Tax Fees(3) |
|
| 2,822,430 |
|
|
| 3,489,012 |
|
All Other Fees |
|
| — |
|
|
| — |
|
(1) | Represents fees for the audit of the Company’s consolidated financial statements and reviews of the consolidated financial statements filed with the SEC in Forms 10‑K and 10‑Q, as well as in connection with audits of the financial statements of certain of the Company’s subsidiaries and Affiliates. |
(2) | Represents fees for attest services not required by statute or regulation, benefit plan audits and accounting consultations. |
(3) | Represents fees for tax compliance and consulting services for the Company and certain of its subsidiaries and Affiliates. |
In making its determination regarding the independence of PricewaterhouseCoopers,PwC, the Audit Committee considered whether the provision of the services covered in the sections entitled "Audit-Related Fees"“Audit‑Related Fees” and "Tax Fees"“Tax Fees” was compatible with maintaining such independence.
The appointment of the independent registered public accounting firm to audit the Company'sCompany’s financial statements is approved each year by the Audit Committee. At the beginning of the year, the Audit Committee also evaluates other potential engagements by the Company of the accounting firm and approves or rejects each service considering (among other factors) the possible impact of each non-auditnon‑audit service on the accounting firm'sfirm’s independence from management. In accordance with its charter, the Audit Committee pre-approvespre‑approves all auditing services and the terms thereof and any non-auditnon‑audit services provided by the independent registered public accounting firm unless an exception to such pre-approvalpre‑approval exists under the Exchange Act or the rules of the SEC. The Audit Committee carefully considers the fees that are proposed to be paid in connection with the approval of audit and non-auditnon‑audit services, and then closely monitors the fees incurred in connection with the provision of such services throughout the year. At each meeting, the Audit Committee receives updates from management on the services that have been provided and fees incurred; from time to time, the Audit Committee may also consider and approve the provision of additional services. In the event that a need arises for the approval of additional services between meetings, the services would be considered and provisionally approved by a designated member of the Audit Committee who would present the scope and fees of the services provisionally pre-approvedpre‑approved at the following meeting of the Audit Committee.
SECURITY OWNERSHIP OF MANAGEMENT
AND CERTAIN BENEFICIAL OWNERS
The following table sets forth information as of March 15, 20162019 (unless otherwise noted), regarding the beneficial ownership of common stock by (i) persons or "groups"“groups” (as that term is used in Section 13(d)(3) of the Exchange Act) known by us to be the beneficial owner of more than 5% of the common stock of the Company, (ii) named executive officers, (iii) directors and (iv) directors and executive officers as a group. Except as otherwise indicated, we believe, based on information furnished by such persons, that each person listed below has sole voting and investment power over the shares of common stock shown as beneficially owned, subject to community property laws, where applicable.
Name of Beneficial Owner(1) | Number of Shares Beneficially Owned(2) | Percent of Common Stock(2) | |||||
|---|---|---|---|---|---|---|---|
The Vanguard Group(3) | 4,550,660 | 8.42 | % | ||||
BlackRock, Inc.(4) | 3,358,142 | 6.20 | % | ||||
Sean M. Healey(5) | 318,380 | * | % | ||||
Nathaniel Dalton(6) | 360,482 | * | % | ||||
Jay C. Horgen(7) | 160,984 | * | % | ||||
Andrew Dyson(8) | 43,860 | * | % | ||||
David M. Billings | 1,101 | * | % | ||||
Samuel T. Byrne(9) | 19,560 | * | % | ||||
Dwight D. Churchill(10) | 21,123 | * | % | ||||
Glenn Earle(11) | 826 | * | % | ||||
Niall Ferguson(12) | 2,139 | * | % | ||||
Tracy P. Palandjian(13) | 8,229 | * | % | ||||
Patrick T. Ryan(14) | 38,977 | * | % | ||||
Jide J. Zeitlin(15) | 81,945 | * | % | ||||
Directors and executive officers as a group (12 persons)(16) | 1,057,606 | 1.96 | % | ||||
Name of Beneficial Owner(1) |
| Number of Shares Beneficially Owned(2) |
| Percent of Common Stock(2) | ||||||
The Vanguard Group(3) |
|
| 5,609,895 |
|
|
| 10.86 | % | ||
EdgePoint Investment Group Inc. (4) |
|
| 4,652,660 |
|
|
| 9.00 | % | ||
BlackRock, Inc.(5) |
|
| 3,445,712 |
|
|
| 6.67 | % | ||
State Street Corporation(6) |
|
| 2,698,537 |
|
|
| 5.22 | % | ||
Nathaniel Dalton(7) |
|
| 236,896 |
|
|
| * |
|
| |
Sean M. Healey(8) |
|
| 183,257 |
|
|
| * |
|
| |
Jay C. Horgen(9) |
|
| 102,567 |
|
|
| * |
|
| |
Hugh P. B. Cutler(10) |
|
| 2,697 |
|
|
| * |
|
| |
David M. Billings(11) |
|
| 15,105 |
|
|
| * |
|
| |
Samuel T. Byrne(12) |
|
| 28,239 |
|
|
| * |
|
| |
Dwight D. Churchill(13) |
|
| 17,305 |
|
|
| * |
|
| |
Glenn Earle(14) |
|
| 7,170 |
|
|
| * |
|
| |
Niall Ferguson(15) |
|
| 9,885 |
|
|
| * |
|
| |
Tracy P. Palandjian(16) |
|
| 14,932 |
|
|
| * |
|
| |
Patrick T. Ryan(17) |
|
| 29,015 |
|
|
| * |
|
| |
Karen L. Yerburgh(18) |
|
| 719 |
|
|
| * |
|
| |
Jide J. Zeitlin(19) |
|
| 90,624 |
|
|
| * |
|
| |
Directors and executive officers as a group (13 persons)(20) |
|
| 738,411 |
|
| 1.43 | % | |||
* | Less than 1% |
(1) | The mailing address for each executive officer and director is c/o Affiliated Managers Group, Inc., 777 South Flagler Drive, West Palm Beach, Florida 33401. In certain cases, voting and investment power of certain shares may be shared by an executive officer with one or more family members who reside in the executive’s household. |
(2) | In computing the number of shares of common stock beneficially owned by a person, (i) shares of common stock subject to options held by that person that are currently exercisable or that become exercisable within the measurement period are deemed outstanding and (ii) shares of common stock underlying restricted stock units held by that person that are currently unvested or unsettled and that will remain so through the measurement period are not deemed outstanding. For purposes of computing the percentage owned, shares of common stock subject to options that are currently exercisable or that become exercisable within the measurement period are deemed to be outstanding for the holder thereof, but are not for the purpose of computing the ownership percentage of any other person. As of March 15, 2019, a total 51,658,851 shares of common stock were outstanding. |
(3) | Information is based on a Schedule 13G‑A filed with the SEC on February 11, 2019 by The Vanguard Group as of December 31, 2018. The Vanguard Group beneficially owns an aggregate of 5,609,895 shares of common stock, with sole voting power over 63,680 of such shares, shared voting power over 9,095 of such shares, sole dispositive power over 5,539,039 of such shares and shared dispositive power over 70,856 of such shares. The address of The Vanguard Group is listed in such Schedule 13G‑A as 100 Vanguard Blvd., Malvern, PA 19355. |
(5) | Information is based on a Schedule 13G‑A filed with the SEC on February 4, 2019 by BlackRock, Inc. as of December 31, 2018. BlackRock, Inc. beneficially owns an aggregate of 3,445,712 shares of common stock, with sole voting power over 2,993,457 of such shares and sole dispositive power over all of such shares (with no shared voting or dispositive power reported). The address of BlackRock, Inc. is listed in such Schedule 13G‑A as 55 East 52nd Street, New York, NY 10055. |
(6) | Information is based on a Schedule 13G filed with the SEC on February 13, 2019 by State Street Corporation as of December 31, 2018. State Street Corporation beneficially owns an aggregate of 2,698,537 shares of common stock, with shared voting and dispositive power over 2,452,320 of such shares (with no sole voting or dispositive power reported). The address of State Street Corporation is listed in such Schedule G as State Street Financial Center, One Lincoln Street, Boston, MA 02111. |
(7) | Includes 53,985 shares of common stock subject to options exercisable within the measurement period. Excludes 48,435 shares of common stock underlying outstanding restricted stock unit awards subject to time‑based vesting conditions and 80,980 shares of common stock underlying outstanding restricted stock unit awards that are also subject to performance‑based vesting conditions that will, in each case, remain unvested or unsettled through the measurement period. |
(8) | Includes 91,902 shares of common stock subject to options exercisable within the measurement period. Excludes 71,038 shares of common stock underlying outstanding restricted stock unit awards subject to time‑based vesting conditions and 105,550 shares of common stock underlying outstanding restricted stock unit awards that are also subject to performance‑based vesting conditions that will, in each case, remain unvested or unsettled through the measurement period. |
(9) | Includes 41,131 shares of common stock subject to options exercisable within the measurement period. Excludes 43,091 shares of common stock underlying outstanding restricted stock unit awards subject to time‑based vesting conditions and 48,622 shares of common stock underlying outstanding restricted stock unit awards that are also subject to performance‑based vesting conditions that will, in each case, remain unvested or unsettled through the measurement period. |
(10) | Excludes 9,309 shares of common stock underlying outstanding restricted stock unit awards subject to time‑based vesting conditions and 10,530 shares of common stock underlying outstanding restricted stock unit awards that are also subject to performance‑based vesting conditions that will, in each case, remain unvested or unsettled through the measurement period. |
(11) | Includes 8,098 shares of common stock subject to options exercisable within the measurement period. Excludes 5,952 shares of common stock underlying outstanding restricted stock unit awards subject to time‑based vesting conditions and 6,890 shares of common stock underlying outstanding restricted stock unit awards that are also subject to performance‑based vesting conditions that will, in each case, remain unvested or unsettled through the measurement period. |
(12) | Includes 15,746 shares of common stock subject to options exercisable within the measurement period. Excludes 1,093 shares of common stock underlying outstanding restricted stock unit awards subject to time‑based vesting conditions that will remain unvested through the measurement period. |
(13) | Includes 12,335 shares of common stock subject to options exercisable within the measurement period. Excludes 1,093 shares of common stock underlying outstanding restricted stock unit awards subject to time‑based vesting conditions that will remain unvested through the measurement period. |
(14) | Includes 6,130 shares of common stock subject to options exercisable within the measurement period. Excludes 1,093 shares of common stock underlying outstanding restricted stock unit awards subject to time‑based vesting conditions that will remain unvested through the measurement period. |
(15) | Includes 8,283 shares of common stock subject to options exercisable within the measurement period. Excludes 1,093 shares of common stock underlying outstanding restricted stock unit awards subject to time‑based vesting conditions that will remain unvested through the measurement period. |
(16) | Includes 12,335 shares of common stock subject to options exercisable within the measurement period. Excludes 1,093 shares of common stock underlying outstanding restricted stock unit awards subject to time‑based vesting conditions that will remain unvested through the measurement period. |
(17) | Includes 15,746 shares of common stock subject to options exercisable within the measurement period. Excludes 1,093 shares of common stock underlying outstanding restricted stock unit awards subject to time‑based vesting conditions that will remain unvested through the measurement period. |
(19) | Includes 15,746 shares of common stock subject to options exercisable within the measurement period. Excludes 1,093 shares of common stock underlying outstanding restricted stock unit awards subject to time‑based vesting conditions that will remain unvested through the measurement period. |
(20) | Includes 282,054 shares of common stock subject to options exercisable within the measurement period. |
Section 16(a) Beneficial Ownership Reporting Compliance
Section 16(a) of the Exchange Act requires our executive officers and directors, and persons who own more than 10% of a registered class of the Company'sCompany’s equity securities, to file reports of ownership and changes in ownership of our equity securities with the SEC and NYSE. Executive officers, directors and greater than 10% stockholders are required by SEC regulations to furnish to the Company copies of all Section 16(a) forms that they file. To our knowledge, based solely on a review of copies of such reports, all Section 16(a) filing requirements applicable to our executive officers, directors and greater than 10% beneficial owners have been satisfied, except that a Form 4 filing (in connection with shares automatically surrendered to the Company on each of June 30, 2014 and 2015 for settlement of tax withholding obligations) reporting a total of 515 shares was inadvertently filed late for Mr. Billings due to an administrative error.satisfied.
Related Person Transactions
We previously granted awards of units of profits interests under the 2010 Long-Term Equity Interests Plan, the 2011 Long-TermLong‑Term Equity Interests Plan and the 2012 Long-TermLong‑Term Equity Interests Plan (together, the “Plans”) to certain of our named executive officers as part of our compensation program, all of which were fully vested as of December 31, 2015. A portion of the vestedVested units under the 2010 Long-Term Equity Interests Plan was available for salePlans generally may be called by the Company or put by the holder subject to the Company at fair value interms of the first quarter of 2016, payable in cash or shares of our common stock.Plans. In the first quarter of 2016,2019, Mr. Healey,Dalton, the Company's Chairman andCompany’s Chief Executive Officer, and Mr. Dalton, the Company's President and Chief Operating Officer, each elected to putsell a portion of the units awarded to themhim under the 2010 Long-Term Equity Interests Plan,2011 and 2012 Plans, which were purchased by the Company for cashan aggregate purchase pricesprice of $4.0 million and $2.0 million, respectively.$3.7 million.
Our executive officers and directors may invest from time to time in funds advised by our Affiliates on substantially the same terms as other investors.
Director Removal Provision of our Charter
Section 5 of Article VI of our Amended and Restated Certification of Incorporation (the "Charter") provides that our directors may be removed only for cause. In light of a recent ruling of the Delaware Court of Chancery, we will not attempt to enforce this provision and our Board of Directors is considering removing it from our Charter.
Expenses of Solicitation
The cost of solicitation of proxies will be borne by us. In an effort to have as large a representation of stockholders at the Annual Meeting as possible, special solicitation of proxies may, in certain instances, be made personally or by mail, telephone or other electronic means by one or more of our employees or by a proxy solicitor. We also may reimburse brokers, banks, nominees and other fiduciaries for postage and reasonable clerical expenses of forwarding the proxy materials to their principals who are beneficial owners of common stock.
The Company has retained Innisfree M&A Incorporated, 501 Madison Avenue, New York, NY 10022, for services in connection with the solicitation of proxies for a fee not to exceedof $25,000.
Stockholder Proposals
Any stockholder proposals submitted pursuant to Exchange Act Rule 14a-814a‑8 and intended to be presented at the Company's 2017Company’s 2020 Annual Meeting of Stockholders must be received by us at our principal executive offices on or before December 30, 201619, 2019 to be eligible for inclusion in the Proxy Statement and form of proxy card to be distributed by the Board of Directors in connection with such meeting.
Any stockholder proposals (including recommendations of nominees for election to the Board of Directors) intended to be presented at the Company's 2017 Annual Meeting of Stockholders,proposal, other than a stockholder proposal submitted pursuant to Exchange Act Rule 14a-8,14a‑8, or notice of stockholder nominees for election to the Board of Directors intended to be presented at the Company’s 2020 Annual Meeting of Stockholders, must be received in writing at our principal executive offices no earlier than February 14, 2017,January 30, 2020 nor later than March 31, 2017, together15, 2020. Such stockholder proposals and notice of nominations must satisfy the requirements of our Charter and By‑laws and must comply with all supporting documentationDelaware General Corporation Law, and include the information, representations and materials required by the By-laws.
As required by the By-laws, a stockholder's proposal nominating a director must be sent to the attention of the Company's Secretary and include: (1) the name, age, business address and residence address of the proposed nominee, (2) the principal occupation or employment of the proposed nominee, (3) the class and number of shares of the Company's capital stock that are beneficially owned by the proposed nominee on the date of such stockholder proposal and (4) the consent of the proposed nominee to serve as a director if elected. A stockholder's proposal shall further set forth, among other details, information about the beneficial ownership of capital stock by the stockholder making the proposal, such stockholder's name and address and a description of all arrangements or understandings between such stockholder and the proposed nominee and any other person or persons (naming such person or persons) pursuant to which the nomination is to be made by such stockholder.under our By‑laws. For more complete information on theseour advance notice procedures and requirements for stockholder proposals and notice of nominations, please refer to our By-laws.By‑laws.
Householding of Proxy Statement
Some banks, brokers and other nominee record holders may be participating in the practice of "householding"“householding” proxy statements and annual reports. This means that only one copy of the Notice of Internet Availability or this Proxy Statement and the 20152018 Annual Report on Form 10-K10‑K may have been sent to multiple stockholders in your household. We will promptly deliver a separate copy of our Proxy Statement and 20152018 Annual Report on Form 10-K10‑K to you if you write or call us at the following address or telephone number: Affiliated Managers Group, Inc., 777 South Flagler Drive, West Palm Beach, Florida 33401-6152,33401‑6152, Attention: Investor Relations, (617) 747-3300.747‑3300. If you would like to receive separate copies of these materials in the future, or if you are receiving multiple copies and would like to receive only one copy for your household, you should contact your bank, broker or other nominee record holder, or you may contact us at the above address and telephone number.
Other Matters
The Board of Directors does not know of any matters other than those described in this Proxy Statement that will be presented for action at the Annual Meeting. If other matters are presented, proxies will be voted in accordance with the discretion of the proxy holders.
For those stockholders who receive the Notice of Internet Availability of Proxy Materials, this Proxy Statement and the 20152018 Annual Report on Form 10-K10‑K are available atwww.proxyvote.comwww.proxyvote.com. In addition, a copy of the 20152018 Annual Report on Form 10-K10‑K will be provided without charge upon the written request of any stockholder to Affiliated Managers Group, Inc., 777 South Flagler Drive, West Palm Beach, Florida 33401-6152,33401‑6152, Attention: Investor Relations, and may be found on the Company'sCompany’s website atwww.amg.comwww.amg.com. The 2015This Proxy Statement references materials and information that are available on our website, including our 2018 Annual Report on Form 10-K is10‑K and the “Responsibilities” section of our website, which are not aincorporated by reference into this Proxy Statement and are not part of the Company's proxyCompany’s solicitation materials.
REGARDLESS OF THE NUMBER OF SHARES YOU OWN, YOUR VOTE IS IMPORTANT TO THE COMPANY. PLEASE SUBMIT A PROXY BYOVER THE INTERNET, BY TELEPHONE OR BY RETURNING A COMPLETED, SIGNED AND DATED PROXY CARD OR VOTING INSTRUCTION FORM.
WE ENCOURAGE YOU TO TAKE ADVANTAGE OF INTERNET OR TELEPHONE VOTING. BOTH ARE AVAILABLE 24 HOURS A DAY, 7 DAYS A WEEK. VOTE BY INTERNET - www.proxyvote.com Use the Internet to transmit your voting instructions and for electronic delivery of information up until 11:59 p.m. Eastern Daylight Time the day before the meeting date. Have your proxy card in hand when you access the web site and follow the instructions to obtain your records and to create an electronic voting instruction form. If you vote by Internet or telephone, you do not need to mail back your proxy card. VOTE BY PHONE - 1-800-690-6903 Use any touch-tone telephone to transmit your voting instructions up until 11:59 p.m. Eastern Daylight Time the day before the meeting date. Have your proxy card in hand when you call and then follow the instructions. VOTE BY MAIL Mark, sign and date your proxy card and return it in the postage-paid envelope we have provided or return it to Vote Processing, c/o Broadridge, 51 Mercedes Way, Edgewood, NY 11717. ELECTRONIC DELIVERY OF FUTURE PROXY MATERIALS If you would like to reduce the costs incurred by our company in mailing proxy materials, you can consent to receiving all future proxy statements, proxy cards and annual reports electronically via e-mail or the Internet. To sign up for electronic delivery, please follow the instructions above to vote using the Internet and, when prompted, indicate that you agree to receive or access proxy materials electronically in future years.

AFFILIATED MANAGERS GROUP, INC.
777 SOUTH FLAGLER DRIVE
WEST PALM BEACH, FL 33401 TO VOTE, MARK BLOCKS BELOW IN BLUE OR BLACK INK AS FOLLOWS: E09779-P77014 KEEP THIS PORTION FOR YOUR RECORDS DETACH AND RETURN THIS PORTION ONLY THIS PROXY CARD IS VALID ONLY WHEN SIGNED AND DATED. AFFILIATED MANAGERS GROUP, INC. The Board of Directors recommends you vote FOR each of the following proposals: 1. Election of Directors For Against Abstain For Against Abstain Nominees: ! ! ! ! ! ! ! ! ! ! ! ! ! ! ! ! ! ! ! ! ! ! ! ! a. Samuel T. Byrne e. Sean M. Healey b. Dwight D. Churchill f. Tracy P. Palandjian c. Glenn Earle g. Patrick T. Ryan d. Niall Ferguson h. Jide J. Zeitlin For Against Abstain ! ! ! ! ! ! 2. To approve, by a non-binding advisory vote, the compensation of the Company's named executive officers. 3. To ratify the selection of PricewaterhouseCoopers LLP as the Company's independent registered public accounting firm for the current fiscal year. NOTE: Such other business as may properly come before the meeting or any adjournment or postponement thereof. Please sign exactly as your name(s) appear(s) hereon. When signing as attorney, executor, administrator, or other fiduciary, please give full title as such. Joint owners should each sign personally. All holders must sign. If a corporation or partnership, please sign in full corporate or partnership name by authorized officer. Signature [PLEASE SIGN WITHIN BOX] Date Signature (Joint Owners) Date

WE ENCOURAGE YOU TO TAKE ADVANTAGE OF INTERNET OR TELEPHONE VOTING. BOTH ARE AVAILABLE 24 HOURS A DAY, 7 DAYS A WEEK. VOTE BY INTERNET - www.proxyvote.com Use the Internet to transmit your voting instructions and for electronic delivery of information. Vote by 11:59 P.M. Eastern Daylight Time on May 28, 2019. Have your proxy card in hand when you access the web site and follow the instructions to obtain your records and to create an electronic voting instruction form. If you vote by Internet or telephone, you do not need to mail back your proxy card. VOTE BY PHONE - 1-800-690-6903 Use any touch-tone telephone to transmit your voting instructions. Vote by 11:59 P.M. Eastern Daylight Time on May 28, 2019. Have your proxy card in hand when you call and then follow the instructions. VOTE BY MAIL Mark, sign and date your proxy card and return it in the postage-paid envelope we have provided or return it to Vote Processing, c/o Broadridge, 51 Mercedes Way, Edgewood, NY 11717. ELECTRONIC DELIVERY OF FUTURE PROXY MATERIALS If you would like to reduce the costs incurred by our company in mailing proxy materials, you can consent to receiving all future proxy statements, proxy cards and annual reports electronically via e-mail or the Internet. To sign up for electronic delivery, please follow the instructions above to vote using the Internet and, when prompted, indicate that you agree to receive or access proxy materials electronically in future years. |
TO VOTE, MARK BLOCKS BELOW IN BLUE OR BLACK INK AS FOLLOWS: | ||
E62050-P18806 | KEEP THIS PORTION FOR YOUR RECORDS | |
— — — — — — — — — — — — — — — — — — — — — — — — —— — — — — — — — — — — — — — — — — — — — — — — — —
THIS PROXY CARD IS VALID ONLY WHEN SIGNED AND DATED. | DETACH AND RETURN THIS PORTION ONLY |
AFFILIATED MANAGERS GROUP, INC. | |||||||||||||
The Board of Directors recommends you vote FOR the following: | |||||||||||||
1. | To elect each of the following ten directors of the Company to serve until the 2020 Annual Meeting of Stockholders and until their respective successors are duly elected and qualified. | For | Against | Abstain | |||||||||
2. | To approve, by a non-binding advisory vote, the compensation of the Company’s named executive officers. | ☐ | ☐ | ☐ | |||||||||
3. | To ratify the selection of PricewaterhouseCoopers LLP as the Company’s independent registered public accounting firm for the current fiscal year. | ☐ | ☐ | ☐ | |||||||||
Nominees: | For | Against | Abstain | ||||||||||
1a. | Samuel T. Byrne | ☐ | ☐ | ☐ | |||||||||
1b. | Dwight D. Churchill | ☐ | ☐ | ☐ | |||||||||
1c. | Nathaniel Dalton | ☐ | ☐ | ☐ | NOTE: Such other business as may properly come before the meeting or any adjournment or postponement thereof. | ||||||||
1d. | Glenn Earle | ☐ | ☐ | ☐ | |||||||||
1e. | Niall Ferguson | ☐ | ☐ | ☐ | |||||||||
1f. | Sean M. Healey | ☐ | ☐ | ☐ | |||||||||
1g. | Tracy P. Palandjian | ☐ | ☐ | ☐ | |||||||||
1h. | Patrick T. Ryan | ☐ | ☐ | ☐ | |||||||||
1i. | Karen L. Yerburgh | ☐ | ☐ | ☐ | |||||||||
1j. | Jide J. Zeitlin | ☐ | ☐ | ☐ | |||||||||
Please sign exactly as your name(s) appear(s) hereon. When signing as attorney, executor, administrator, or other fiduciary, please give full title as such. Joint owners should each sign personally. All holders must sign. If a corporation or partnership, please sign in full corporate or partnership name by authorized officer. | |||||||||||||
Signature [PLEASE SIGN WITHIN BOX] | Date | Signature (Joint Owners) | Date | ||||||||||
Important Notice Regarding the Availability of Proxy Materials for the Annual Meeting:
The Notice and Proxy Statement and Form 10-K are available at www.proxyvote.com. E09780-P77014 PROXY FOR ANNUAL MEETING OF STOCKHOLDERS AFFILIATED MANAGERS GROUP, INC. June 14, 2016, 2:00 PM BST (9:00 AM EDT) Solicited on behalf of the Board of Directors The undersigned hereby appoints Sean M. Healey and David M. Billings, and each of them, as proxies, each with full power of substitution, and authorizes them to represent and to vote all of the shares of common stock of Affiliated Managers Group, Inc. (the "Company") that the undersigned is entitled to vote at the Annual Meeting of Stockholders, and at any adjournments or postponements thereof, and hereby grants each of them full power and authority to act on behalf of the undersigned at said meeting and any adjournments or postponements thereof. The Annual Meeting of Stockholders will be held on Tuesday, June 14, 2016, at 2:00 p.m. British Summer Time (9:00 a.m. Eastern Daylight Time), at the Company's London office at 35 Park Lane, London W1K 1RB, United Kingdom. The undersigned hereby revokes any proxy previously given in connection with such meeting and acknowledges receipt of the Notice of Annual Meeting of Stockholders, Proxy Statement and 2015 Annual Report on Form 10-K. This proxy, when properly executed, will be voted in the manner directed herein by the undersigned stockholder. If no such direction is made on the reverse side of this form, this proxy will be voted "FOR" the election of each of the nominees for director listed in Proposal 1, "FOR" Proposal 2 - approval of the compensation paid to the Company's named executive officers, and "FOR" Proposal 3 - ratification of the appointment of PricewaterhouseCoopers LLP as the Company's independent registered public accounting firm. Continued, and to be signed on reverse side

— — — — — — — — — — — — — — — — — — — — — — — — — — — — — — — — — — — — — — — — — — — — — — — — — —
E62051-P18806
PROXY FOR ANNUAL MEETING OF STOCKHOLDERS AFFILIATED MANAGERS GROUP, INC. May 29, 2019, 10:00 AM EDT Solicited on behalf of the Board of Directors The undersigned hereby appoints Nathaniel Dalton and David M. Billings, and each of them, as proxies, each with full power of substitution, and authorizes them to represent and to vote all of the shares of common stock of Affiliated Managers Group, Inc. (the “Company”) that the undersigned is entitled to vote at the Annual Meeting of Stockholders, and at any adjournments or postponements thereof, and hereby grants each of them full power and authority to act on behalf of the undersigned at said meeting and any adjournments or postponements thereof. The Annual Meeting of Stockholders will be held on Wednesday, May 29, 2019, at 10:00 a.m. Eastern Daylight Time, at the Company’s office at 600 Hale Street, Prides Crossing, Massachusetts 01965. The undersigned hereby revokes any proxy previously given in connection with such meeting and acknowledges receipt of the Notice of Annual Meeting of Stockholders, Proxy Statement and 2018 Annual Report on Form 10-K. This proxy, when properly executed, will be voted in the manner directed herein by the undersigned stockholder. If no such direction is made on the reverse side of this form, this proxy will be voted “FOR” the election of each of the nominees for director listed in Proposal 1, “FOR” Proposal 2 - To approve, by a non-binding advisory vote, the compensation of the Company’s named executive officers, and “FOR” Proposal 3 - To ratify the selection of PricewaterhouseCoopers LLP as the Company’s independent registered public accounting firm for the current fiscal year. Continued, and to be signed on reverse side |